In an earlier post, I wrote about my interest in collegiate baseball lineup optimization. I conducted a pilot study using the Seqnzr technology to analyze batting lineups in the Southeastern Conference (SEC) for the 2019 season. My conclusion was that several teams may have missed opportunities to improve run production with a more optimal batting lineup.
To build upon my pilot study and further investigate the use of analytically-based lineups, I expanded my research to include other conferences and years. I chose to replicate the same process for each of the 61 baseball teams that play in the “Power Five” conferences—the SEC, ACC, BIG 10, BIG 12, and PAC 12—for the 2017, 2018, and 2019 collegiate baseball seasons.
With Seqnzr’s recent partnership with 643 Charts, an advanced scouting and analytics source, the data collection and simulation processes were made much more feasible for such a large sample. In continuation of the pilot study, this research presents the significance of using analytically-based lineups. Conducting these simulations allows for general assumptions to be made about the use of analytics within the Power Five conferences. I fully expected the use of analytics within a conference to directly reflect its success, especially in more recent seasons.
Simulations
To begin the second phase of my project, I repeated the same process of utilizing three different lineups for all 61 of the selected college baseball teams. The first lineup was an actual lineup used by the head coach in a critical game (e.g., College World Series, regional playoff, conference tournament; depending on how far the team advanced). The second was based solely on the OPS (on base percentage plus slugging percentage) metric. The third lineup, borrowed from Tango et al.’s (2007) The Book, was derived using a more complex form of the OPS lineup, placing more emphasis on slugging and on base percentage as individual characteristics. (My earlier study details the lineup construction for all three approaches.)
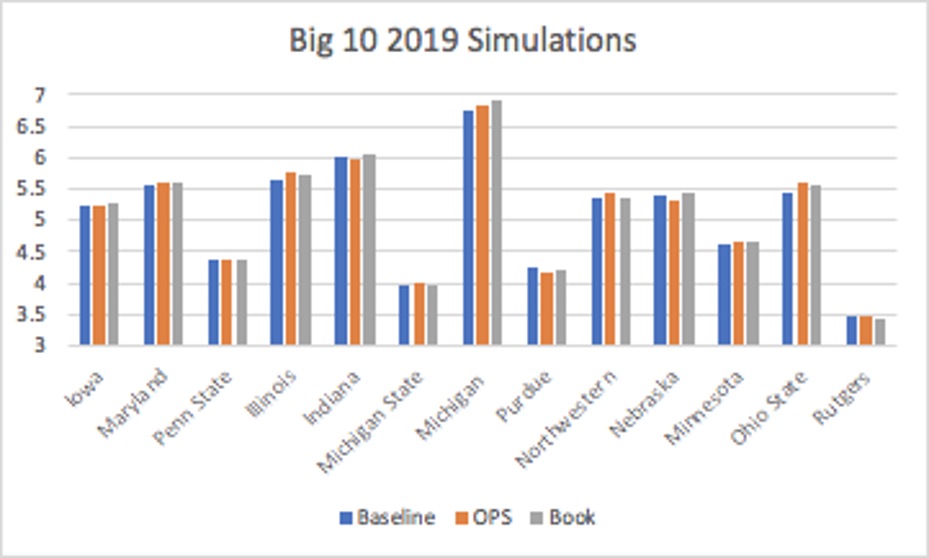
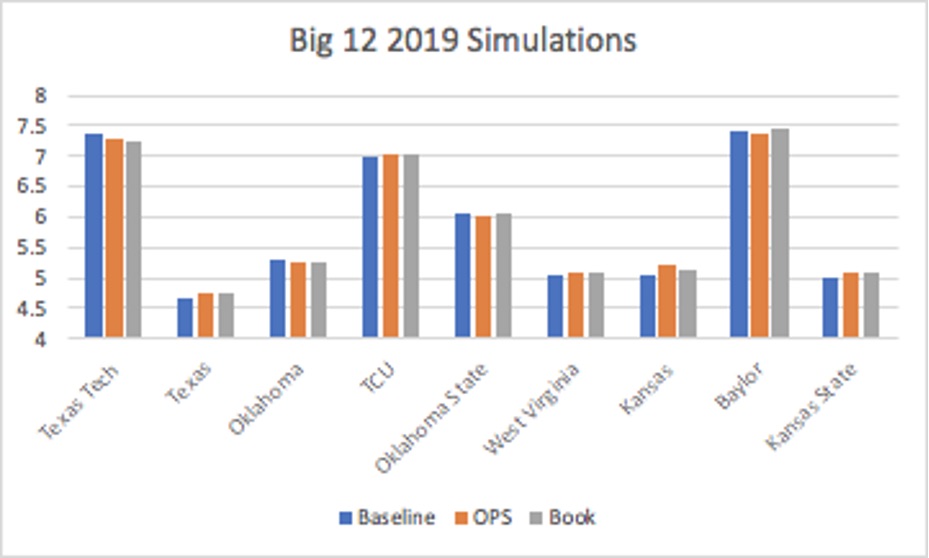
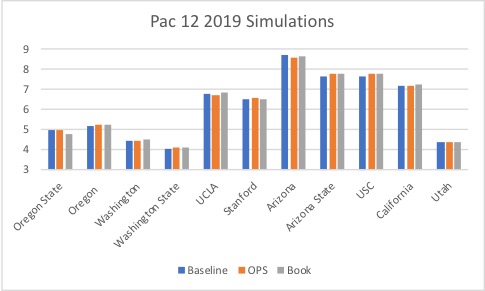
I once again relied on Seqnzr to calculate average expected run production for each of the lineups. Seqnzr begins with a massive distribution of possible outcomes for hitters based on historical data. The software runs 50,000 games using monte carlo simulation to minimize the margin of error for the average expected run output of a given lineup. The bar graphs below display the average projected run output for each team, grouped by conference, for the 2019 season. (The 2019 season was selected to illustrate simply because it had the highest expected run production overall; data for other seasons is available upon request).
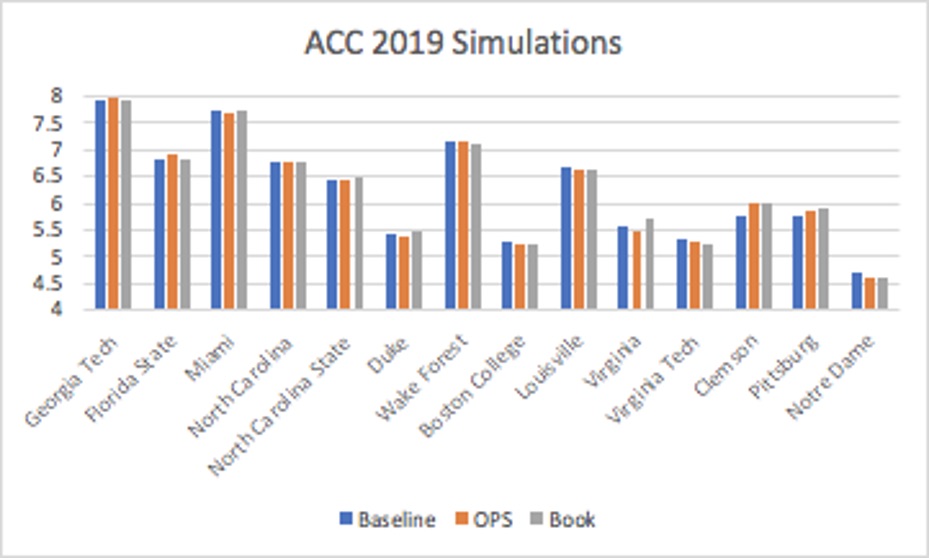
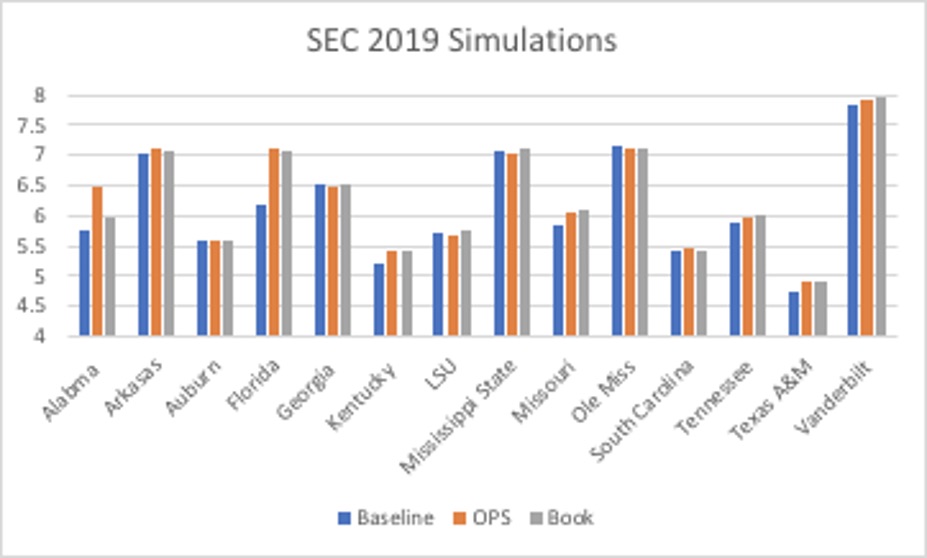
Similar to the results from the pilot study, over half (53.55%) of the teams produced higher run production using the model derived from The Book. Only 23.50% of the teams had their highest output from the “baseline” model. In comparison to the OPS-based model, The Book proved to have an advantage in over 62% of the simulations. By utilizing Tango’s methodology to account for statistical probabilities, teams generally benefited more.
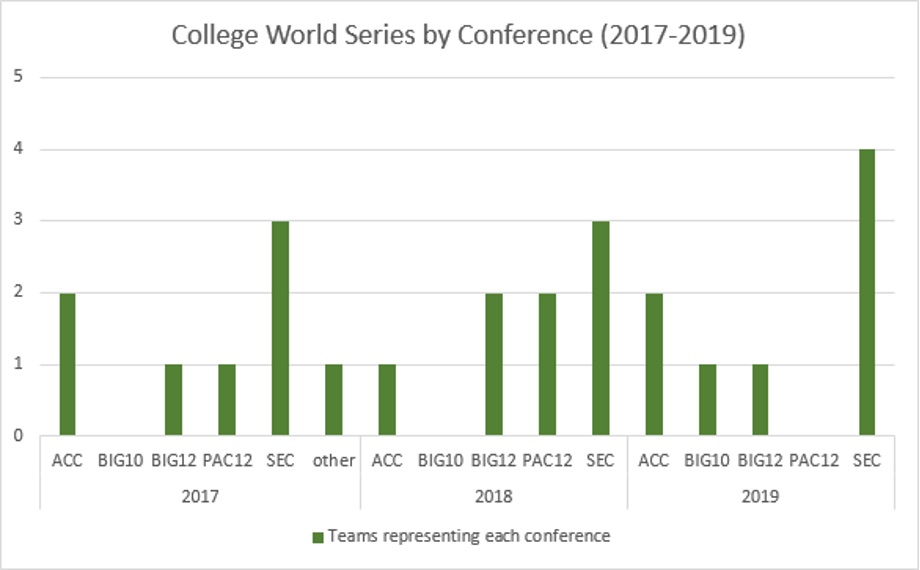
The projected outputs also give insight into why several conferences are achieving greater success in recent years. While this analysis does not take into account specific pitching staffs or defense, we can see that the higher run production for the SEC and ACC has translated into more teams advancing to the College World Series (CWS) during this time period. Over the three years of study, ten SEC teams have advanced to the CWS, while five teams have represented the ACC. The Big 12 was next with four teams, then the Pac 12 with three. The Big 10 had only one representative over the last three CWS tournaments. The following graph shows the CWS breakdown by conference for 2017-2019.
Statistical Analysis
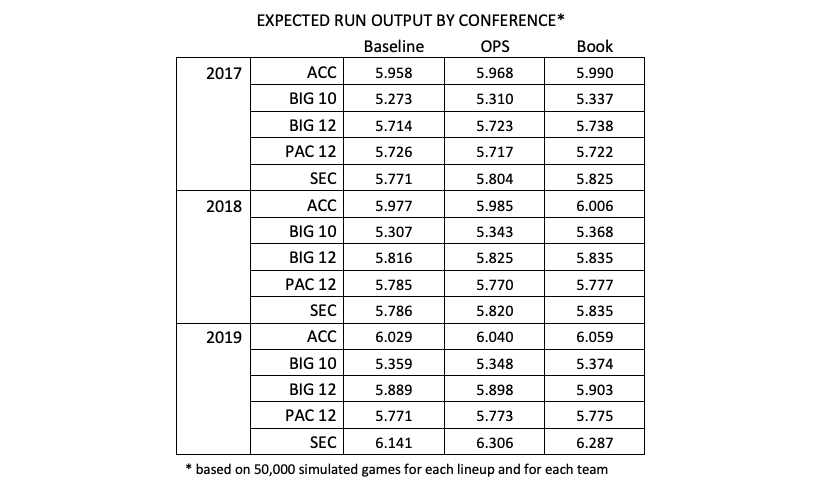
Upon the conclusion of the simulations, I also wanted to look at this data in aggregate (at the conference level). Therefore, I created a mean run production score for each conference for each of the years under study. The chart below shows the average expected run output by conference for each of the three lineup approaches. As you can see from this data, run production continues to increase each year, across all five conferences. Another interesting observation here is that Pac 12 coaches appear to be utilizing lineup optimization successfully, as the baseline average of projected outputs for all three years is nearly identical or exceeds The Book’s model.
This aggregation allowed me to analyze lineups at the conference level by utilizing t-tests, a statistical test to determine if there is a significant difference in the means of two groups of data. Running these t-tests gave me the ability to interpret the statistical differences within these lineups, specifically focusing on the difference in projected outputs. Because t-tests only process two data groups per test, I ran three different tests for every conference and each year.
T-Test 1: Baseline and The Book
T-Test 2: Baseline and OPS
T-Test 3: OPS and The Book
Based on the trends revealed in the majority of simulations of my pilot study on the SEC, I expected the “baseline” model would be statistically different (lower) that the OPS-based model and The Book model. Furthermore, I expected the t-tests to reveal that the OPS-based model and The Book were not statistically different, as they both rely heavily on the OPS metric (or the components within that metric). With the last four hitters in both lineups being positioned in the same order (most of the time), I expected that the projected outputs in these simulations to have little variance, failing to provide enough evidence that the lineups were statistically different.
Results
After completing all of the t-tests, I was able to identify some very interesting trends and results from the Power Five conferences. The use of analytics can be measured across the Power Five conferences based on the similarity of these outputs. For example, if one conference is averaging a similar amount of runs per game in both its “baseline” and Book simulations, this particular conference might use analytics (specifically, OPS-related analytics) more than its competition. The chart below shows the output of the t-tests, with the green cells highlighting the tests showing significant differences per the results of the t-tests.
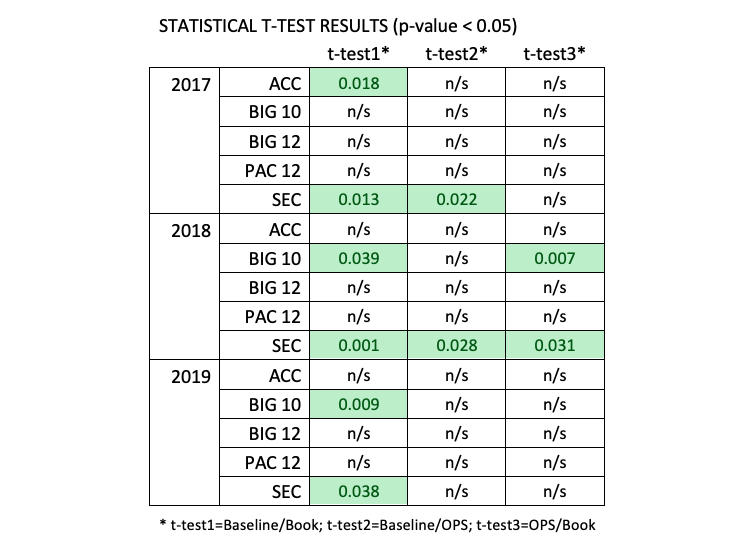
My original hypothesis held true for the SEC for 2017, 2018, and 2019. The baseline lineups were different than the analytics-derived lineups in most cases (the only exception was the 2019 comparison between the baseline and OPS lineups), and it seems SEC coaches (on the whole) utilize a more traditional lineup development. However, other conferences, specifically the ACC, Big 12, and Pac 12, appeared to utilize OPS-based analytics more in their lineup construction, as their baselines, on average, were not statistically different than the analytically-derived ones. This was surprising, based on the recent success of the SEC. It also showed the value of conducting the more thorough analysis, and not simply accepting the approach of the SEC as an assumption for how other collegiate programs construct lineups.
I also found interest in that several seasons showed significant differences between the OPS and Book simulations (2018 Big 10, 2018 SEC). This further demonstrates the importance of detail in deriving lineups, as even small adjustments in lineup order can make significant improvements over the course of a season.
Post Hoc Analysis
While in the process of the statistical analysis, I became more interested as to why the SEC did not seem to be as analytically driven as some other conferences. However, the SEC always is known to have some of the best teams and phenomenal players. With these t-tests suggesting that the SEC might be the least analytically-inclined conference, can these teams just ‘get away with it’ because of their talent?
To answer this question, I wanted to compare the OPS-based models from the 2019 season. I utilized a very similar process as the original statistical analysis by using t-tests to compare the outputs generated from their simulations. By just using the OPS-based models, it will give a better player-to-player comparison.
Based on these results from this sample (see below), there does appear to be a statistical difference between the SEC and the Big 10. The SEC does seem to have more potent lineups than the Big 10. However, I am unable to conclude any statistical difference between the SEC and the other conferences. This might suggest that the player personnel within the SEC, ACC, Big 12, and Pac 12 was extremely similar (at least from an offensive perspective) during the 2019 season, though the Big 10 – as a whole (Michigan did make the CWS in 2019 and had noticeably higher expected run production relative to the rest of the conference) – did not seem to have quite as strong lineups.

Conclusions
As baseball becomes more competitive at all levels, it is becoming vital to attain whatever advantage possible. The results of my study continue to emphasize the importance of analytically-based lineup construction to improve run production. They also seem to suggest that many collegiate baseball coaches across the Power Five conferences have shifted to using analytics in recent seasons in order to optimize their team’s performance and better compete with powerful programs like those found in the SEC. For smaller and less talented programs, lineup optimization is a relatively easy addition to enhance the opportunities to score runs. It would be interesting to further grow this study by capturing more historical years to see exactly when the trend toward more analytic lineups began in each team and across each conference.
As analytics continue to sweep through college baseball, it will be extremely interesting to follow how the outputs might change. I fully expect SEC coaches to transition more into the use of analytics in their lineup construction. The other conferences will be forced to adapt further to continue to narrow the gap. It might also be interesting to conduct deeper dives into specific teams to better understand their approach. For instance, Georgia Tech, Texas Tech, TCU, Boston College, and Michigan State’s baseline lineup outputs outpaced the alternative lineup approaches in at least two of the three seasons, suggesting that these programs have found other successful techniques of lineup optimization. Continuing to analyze teams that consistently outperform commonly discussed analytical approaches will help uncover how teams are gaining an edge.
Additionally, I look forward to the continued impact of tools like Seqnzr on all levels of baseball. Seqnzr has allowed me to take this project much farther than I ever expected, and software like this can be an asset for coaching staffs looking for a competitive edge. I am also excited to continue watching the ongoing innovation of these products and how they will continue to push new boundaries and explore/uncover new opportunities. Seqnzr, for example, is developing a new segment that allows the user to input their opposing pitcher into a simulation. This would allow users to develop different lineups to account for left/right pitching matchups, heavy off-speed pitchers, or high-velocity arms—a tremendous advantage for simulating specific single-game lineups. As the power of this simulation tool continues to grow, and more analytically-minded coaches begin optimizing their lineups, I expect we will see positive trends in run production with restructured lineups in stadiums from coast to coast.
About the Author
Will David is a third-year student pursing a finance and marking double major with a concentration in sports marketing and analytics. He also plays baseball at Samford University.
Twitter: @will_david3
LinkedIn: www.linkedin.com/in/will-david