In 2013, the NCAA Division I Baseball Committee agreed to implement a change in the RPI model that is used to rank teams and help determine a team’s strength of schedule. The purpose of this change was primarily to level the playing field for northern teams that were being forced to play large parts of their spring season on the road because of winter weather constraints. When RPI was first introduced, there was no difference between the value of home and away games in this model. As a result, northern teams were being indirectly punished because of their need to play more games on the road than teams that were from the South.
After the changes in the RPI model were implemented, there was a significant uptick in the number of northern teams receiving at-large bids into the college baseball playoffs. While this seems like a win for northern teams, these changes have also given an extra advantage to another group of teams, those from the Power Five conference. This raises the question of whether the current RPI model gives an unfair advantage to Power Five schools over mid-majors.
What is the RPI?
To determine whether the current RPI system heavily favors some teams over others it is important to first clarify what RPI is and how it is calculated. Put simply, RPI is an equation that helps to determine a team’s strength of schedule by assigning values for each win and loss and by using a specific equation to weigh the value of these wins and losses. The equation consists of multiple different parameters:
- A team’s winning percentage (25%)
- The winning percentage for a team’s opponents (50%)
- The winning percentage for a team’s opponents’ opponents (25%)
The winning percentage of a team’s opponents is the most heavily weighted category. This means that if your opponents have a better record, then your RPI will be better, and if your opponents have a bad record, then your RPI will be lower. These winning percentages are only one aspect of this RPI equation, though.
We have identified two major problems with the current RPI model being deployed by the NCAA which negatively impacts mid-major teams. We utilize data from over 4,000 college baseball games played from 2015 to 2019 to answer the following research question:
Does the current RPI model favor Power Five teams at the expense of Mid-Majors?
Problem #1 – Road wins weighted too heavily
An additional component of the RPI equation consists of different values that are given to each home and away game as mentioned previously. Before 2013, the RPI model only had home and away wins and losses at a value of 1.0, this meant that there was no valuation difference between home and away games, and this is what was putting the northern teams at such a disadvantage. After 2013, those numbers were changed so that home wins were assigned a value of 0.7 and road wins a value of 1.3. This created a noticeable difference, making winning on the road much more valuable than winning at home. On the other side of the coin, each home loss was also assigned a (negative) value of 1.3, and each road loss a value of 0.7. Thus, losing on the road resulted in a much smaller RPI penalty than losing at home.
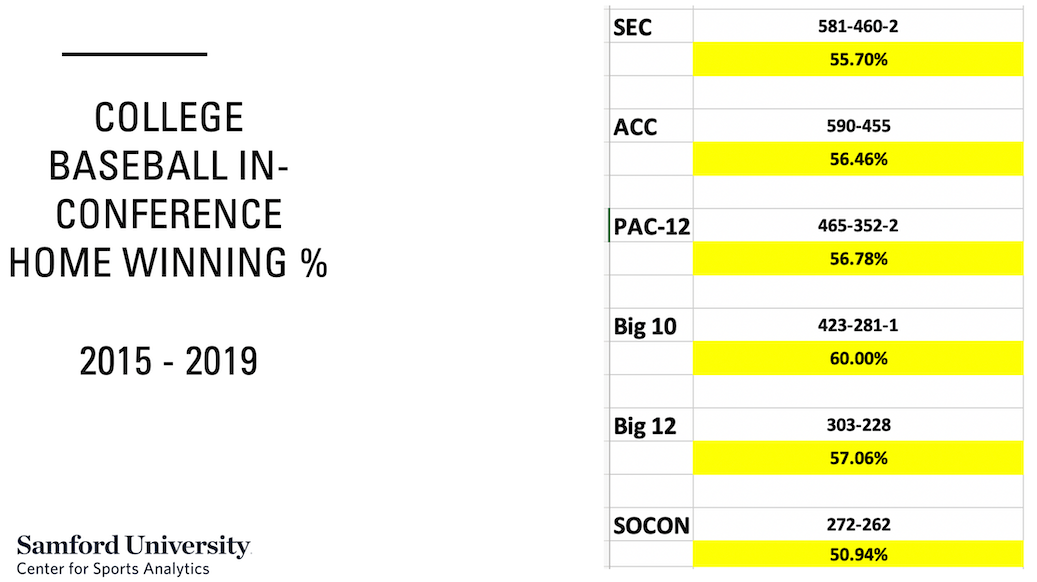
Underlying the 1.3 / 0.7 concept is the assumption that the home team has an advantage and typically wins approximately 70% of the time. While previous research conducted by the Center for Sports Analytics at Samford University has validated this is true for college basketball, our analysis of college baseball paints a very different story.
We examined data from every conference game played in the Power Five and SOCON conferences from 2015 to 2019. In order to eliminate disparities in home winning percentage created because of difference in the quality of out-of-conference opponents, we only examined in-conference games played. In total we analyzed over 4,000 games. As can be seen in the below table, in-conference home winning percentage is between 55% to 60%. Thus, we would argue that the RPI model for college baseball should be adjusted to give less weight for a road win -- possibly 1.2 / 0.8 or 1.1 / 0.9. Such an adjustment would better reflect the actual value of winning on the road in college baseball and would eliminate the unfair advantage accruing to teams that play a significant percentage of their games on the road – such as northern schools and schools with more resources and ability to travel (i.e. Power Five teams).
As an example, to help put this into perspective, we might consider a four-game series in which Wisconsin played on the road at Auburn. If Wisconsin and Auburn to split the series 2-2, the teams’ RPIs after the series (not calculating the winning percentages, just the values for each game) would be quite different. Auburn would end up at -1.2 (-1.3 + -1.3 + 0.7 + 0.7), while Wisconsin would be at +1.2 (1.3 + 1.3 + -0.7 + -0.7). Both teams would have won and lost two games, but the team that played on the road would be awarded extra RPI points since playing on the road is usually harder.
Problem #2 – In-conference winning % weighted too heavily
As was mentioned above, the winning percentage of a team’s opponents is the most heavily weighted category making up 50% of the RPI model. This puts mid-majors at a significant disadvantage in the following way.
The teams that are selected for the college baseball playoffs are selected by the NCAA Division I committee. The committee gives out 31 automatic bids to each of the conference champions and then issues 33 at-large bids. At issue is the fact that the large majority of these at-large bids go to Power Five teams, even when those teams finish the regular season with poor and even losing records. Of the thirty-three at-large bids given out to teams in 2019, only five were given to teams outside of the Power Five conferences. Two such teams that would fit into this category would be teams like Florida who only went 14-17 in the SEC and Clemson who went 15-15 in their ACC and yet still received tournament bids.
If some of these at-large teams have poor win-loss records, how are they getting in? It comes down to the structure of the RPI equation. Because the RPI equation puts a heavier weight on your opponents’ winning percentage, simply being in a good conference will result in an inflated RPI because you end up playing better teams. And this is the case even if your own team does not perform well in the conference.
Take, for example, Florida and Samford University.
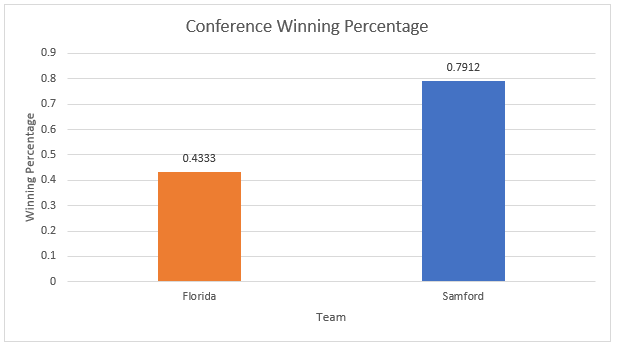
Florida was the last team in the SEC to get an at-large bid in 2019. Florida had a .4333 winning percentage in the SEC, while Samford had a .7912 in the SOCON. Despite Samford’s dominating its conference, losing only five conference games, they did not make the tournament and were ranked #72 on the RPI rankings. Meanwhile, Florida, who had a very sub-par year, was ranked #30 in the RPI rankings, and did receive a bid.
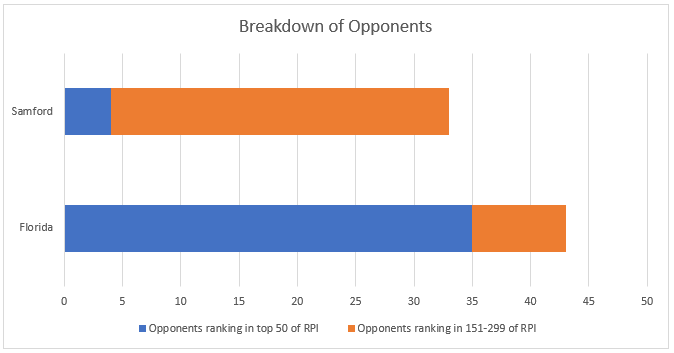
The reason for this disparity is simply that the majority of the teams Florida played were in-conference, and those conference teams all ranked in the top 50 in terms of RPI. The majority of Samford’s conference opponents ranked in the 151-299 range of RPI. Samford was forced to play these opponents with worse records and RPI rankings because they are in the same conference.
This highlights the glaring issue: Your opponents’ winning percentage and non-conference games.
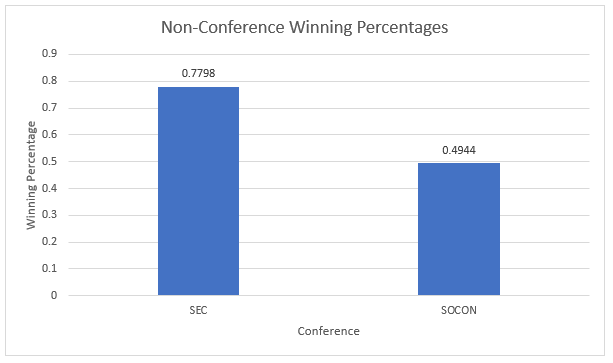
The SEC had a non-conference winning percentage of .7798 in 2019, while the SOCON only had a winning percentage of .4944. The SEC also played 58 more non-conference games than the SOCON did, though that is in part because there are more teams in the SEC. The reason for this is because the SEC teams have the money and resources to go out and find easier and smaller teams to play. Thus, they are able to essentially “boost” their conference winning percentage by playing a lot of easier teams. When SEC teams play conference games, they play against other SEC teams that also have good records, because those records are boosted by their playing these easier non-conference games. The result is that their RPIs are higher because their opponents’ winning percentages are better.
Conclusion
It is not surprising that more Power Five schools qualify for the college baseball playoffs as compared to mid-majors. They typically have better teams because of their ability to recruit more effectively and because of the resources they have. However, as has been shown above, the current RPI model makes it extremely difficult for mid-majors to qualify for the tournament even when they have a strong team.
Our analysis shows that the current RPI model needs to be tweaked in order to avoid the situation where a genuinely deserving mid-major team performs well throughout the season but still fails to get a tournament bid, while a Power Five team that doesn’t perform well during the season gets that tournament spot simply because they were in a conference with a higher overall winning percentage and had the ability to play more games on the road.
In 2016, Costal Carolina proved once and for all that mid-majors can compete at the highest level. The time has come for the NCAA to recognize this fact and make the necessary adjustments to the RPI model to allow well deserving, mid-major teams access to the College World Series.
Author Bio: Samuel Leonard is a senior sports analytics and finance student in the Brock School of Business at Samford University. You can read more about Samuel on his LinkedIn profile.
Sources
https://www.warrennolan.com/baseball/2019/nitty-team
https://www.warrennolan.com/baseball/2019/conferencerpi
https://datasportsgroup.com/images/news/sub/baseball-sports-data.png