
Bill James is a world-famous American baseball writer and statistician who is known for his analytical contributions to the game of baseball. One of his largest contributions was the Pythagorean Theorem of Baseball. The theorem relates the number of runs a team scores and gives up to determine its estimated winning percentage, which is an indicator of future team performance (1). James’ formula is seen below:
In this formula, James uses runs scored and runs allowed to calculate an estimate of how many wins a team will earn. He claimed runs are the key determinant of wins and that all it takes is scoring more than your opponent to predict win percentage. The value of runs are very important for wins, but there could be other statistics that are either more important than runs or help explain why teams score or allow more or less runs. I decided to dig deeper to see if there was any information James was missing.
I looked at seventy-one different offensive, defensive, and pitching statistics from FanGraphs for all thirty MLB teams and compared each statistic to every team's win percentage from the 2021 MLB season. This gave me a correlation which I used to rank each statistic from most important to least important. The correlation range is as follows: 0.000-0.290 (red) is not correlated, 0.291-0.500 (orange) is moderately correlated, and 0.501-1.000 (green) is heavily correlated. Here are the rankings:
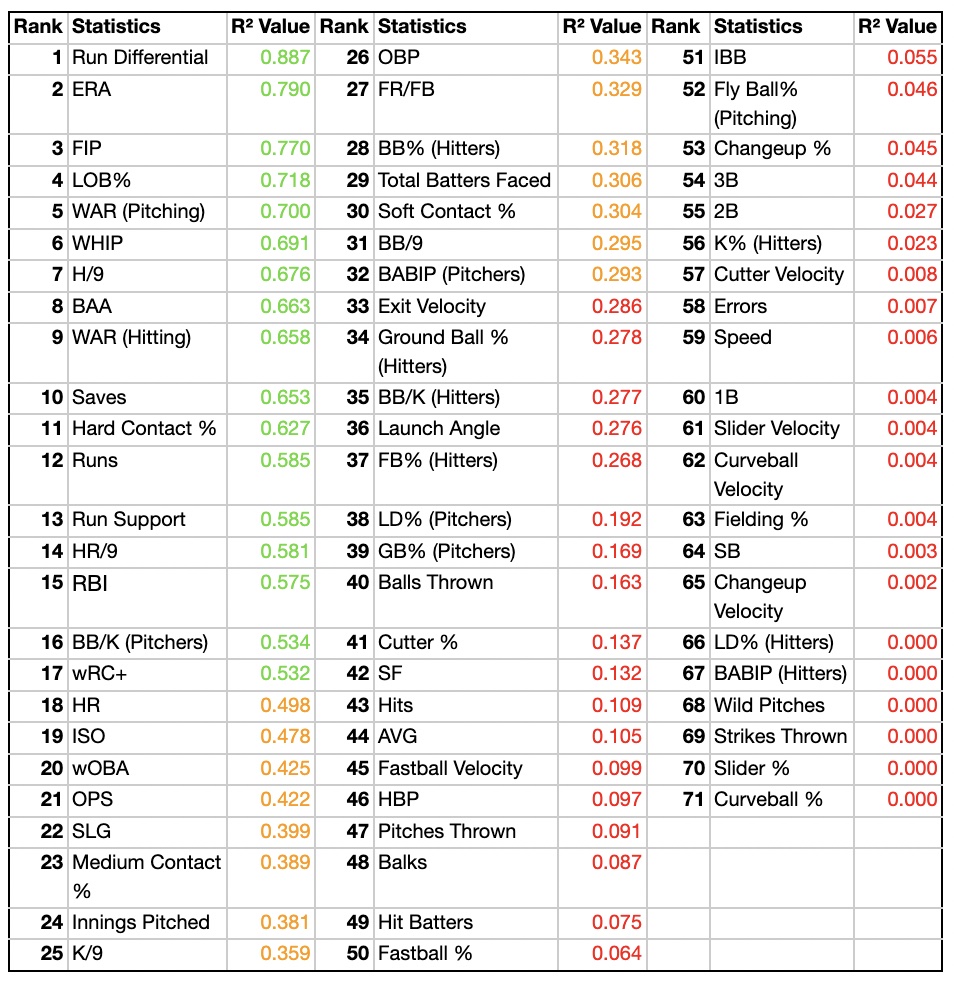
Many of the statistics above have significant outliers that were calculated separately. These are the raw correlation calculations for transparent and accurate comparisons. These numbers were pulled only from the 2021 season, so correlations vary by season. From these numbers, I created five important takeaways to be interpreted from the data.
Run Differential Importance and Breakdown
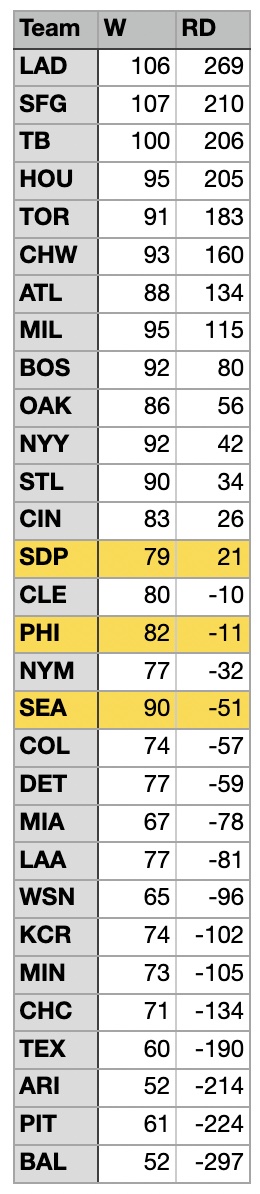
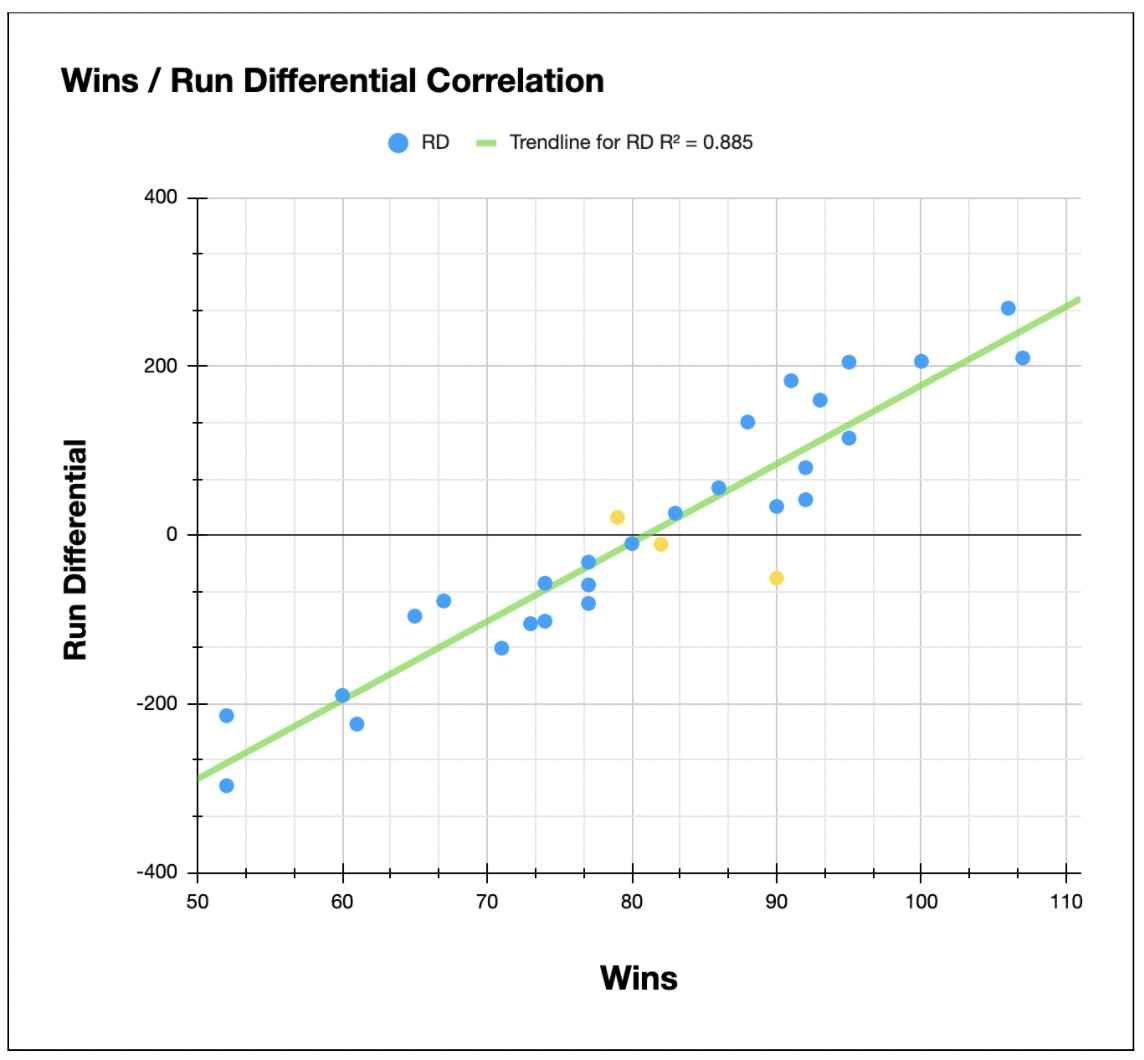
The Pythagorean Theorem of Baseball is a momentous contribution to baseball statistics. To this day, the formula reigns true. Teams have a higher win percentage when they outscore their opponents. Run differential, the simplified version of the Pythagorean Theorem of Baseball, breaks the formula down to one statistic. This is the leading statistic relating to highest wins in 2021. Run differential is calculated by subtracting how many runs were allowed from how many runs a team scored. Instead of having multiple inputs to the Theorem’s formula to calculate a percentage, run differential is just a simple subtraction problem with one whole number that conveys the same meaning in a different way. All teams except for three (San Diego, Philadelphia, and Seattle) either had a positive run differential and a winning record or a negative RD and a losing record. Without these outliers, the r-squared value of RD would have been even higher at 0.920. The more wins a team accumulated, the higher its run differential is on average.
Limiting Runs is More Valuable Than Scoring Runs
After I confirmed that runs are the key for winning, I learned that it is more important to limit runs with pitching than to score them. According to the 2021 season, more pitching related statistics ranked higher than offensive related statistics. ERA is ranked 2nd, FIP is 3rd, LOB% is 4th, pitching WAR is 5th, WHIP is 6th, H/9 is 7th, BAA is 8th, and saves is 10th. The only sole offensive statistic in the top ten is offensive WAR, which is ranked 9th. Also, eleven of the nineteen heavily correlated statistics happen to be related to pitching. To further confirm that pitching statistics contribute to more wins, I compared the correlation of similar hitting and pitching statistics side by side to visualize the numbers.
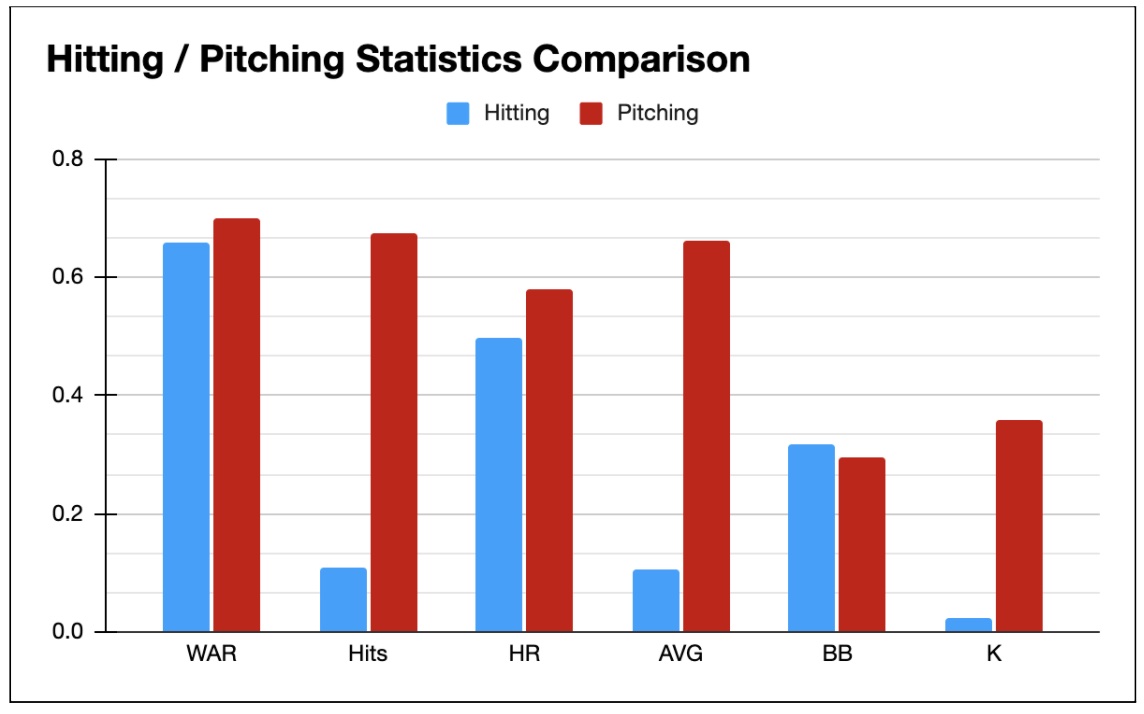
After comparing similar hitting versus pitching statistics and ranking them according to p-value, I concluded that better pitching contributes more to win percentage. Thus, limiting runs with pitching is more valuable to a team’s win total than scoring runs.
Speed Kills?
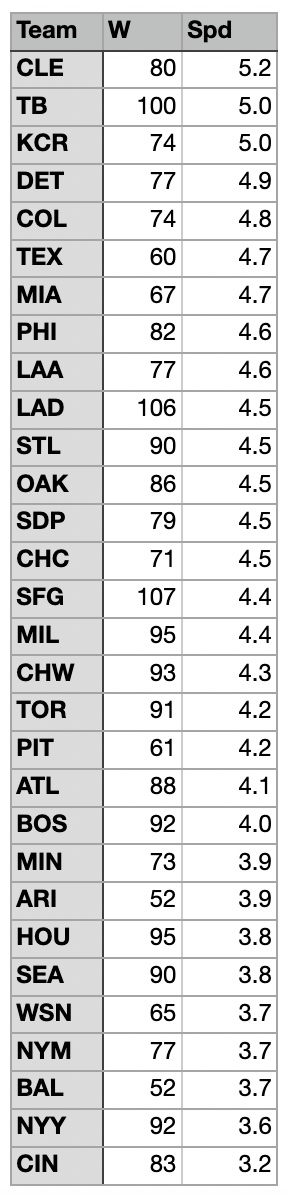
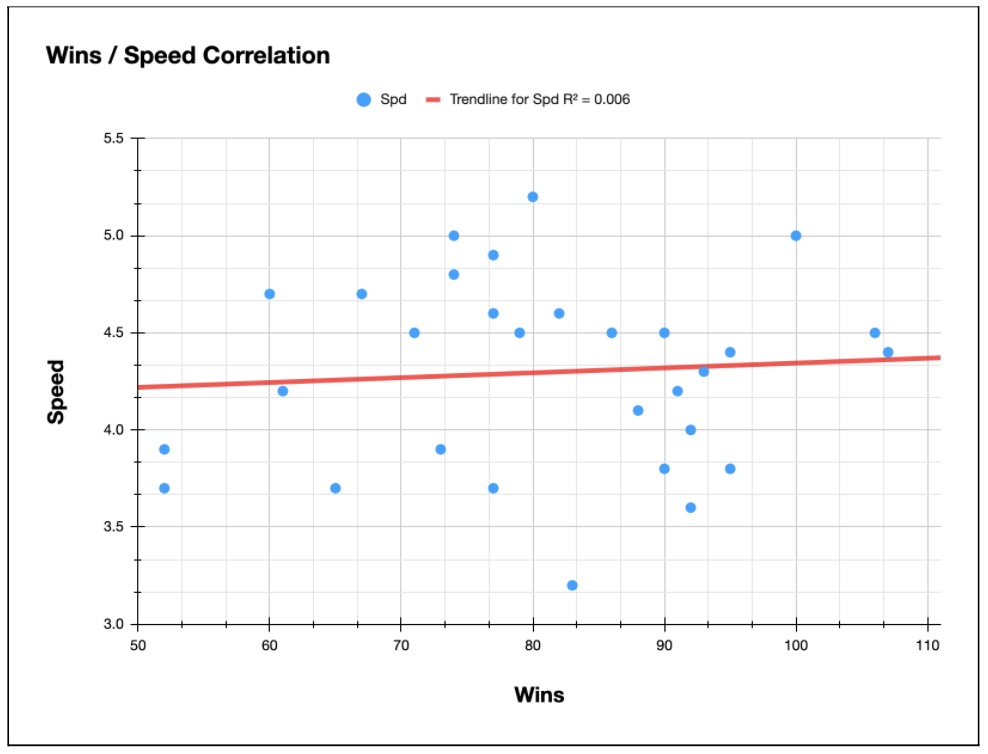
Being fast in baseball is an advantage, but not as much as you think. Individual speed is greatly beneficial but average team speed could not matter any less. Correlation between wins and average team speed is 0.006 which shows that having an all-around fast team does not contribute very much to wins.
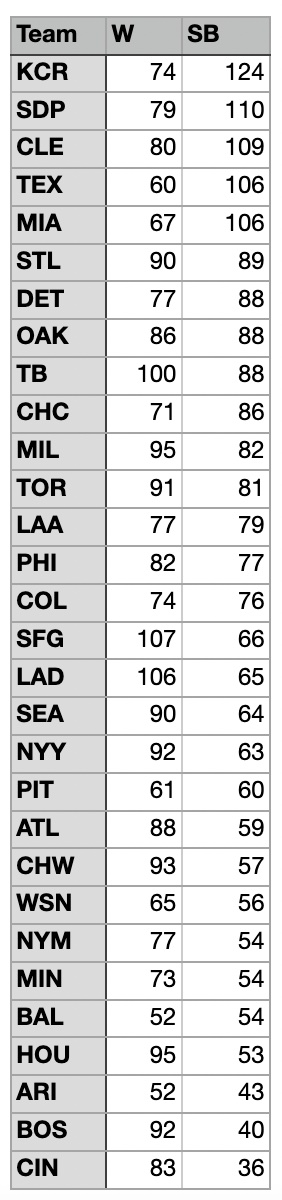
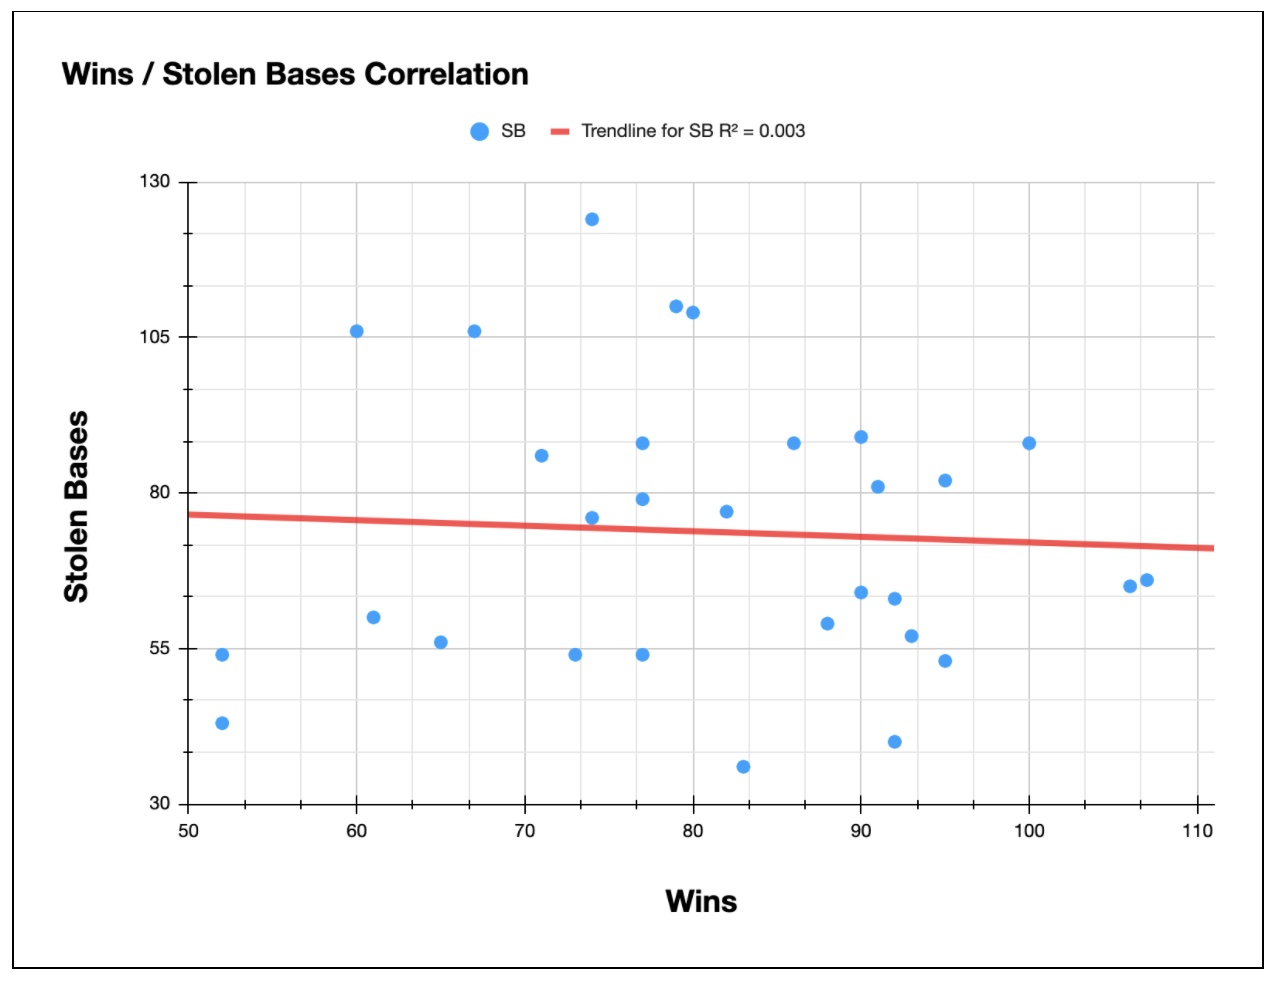
Having a slower team who could create runs would be considered much more valuable. It is possible to compare individual players' speed to their offensive and defensive performance, and doing so would be a much larger correlation. In terms of team performance, that is not the case. This peers into the realm of stolen bases which also do not heavily contribute to wins. The p-value for stolen bases compared to wins is even less than team speed at 0.003. There is a slightly negative trend with more winning teams having less stolen bases.
Stolen bases do not contribute greatly to runs being scored. Stolen bases only put runners in better scoring position which is risky and worthless if the runner is not hit in. It also increases the risk of getting out while on the base paths. With all of these risks, it can be determined that stolen bases can be good for only fast players looking to get in better scoring position and that they do not contribute much to win percentage.
Downplaying Defense
Having players that can make the routine defensive plays is essential for success, but how much does it contribute to wins? Below are the results of error rate and fielding percentage, two important defense metrics, compared to win total for each team.
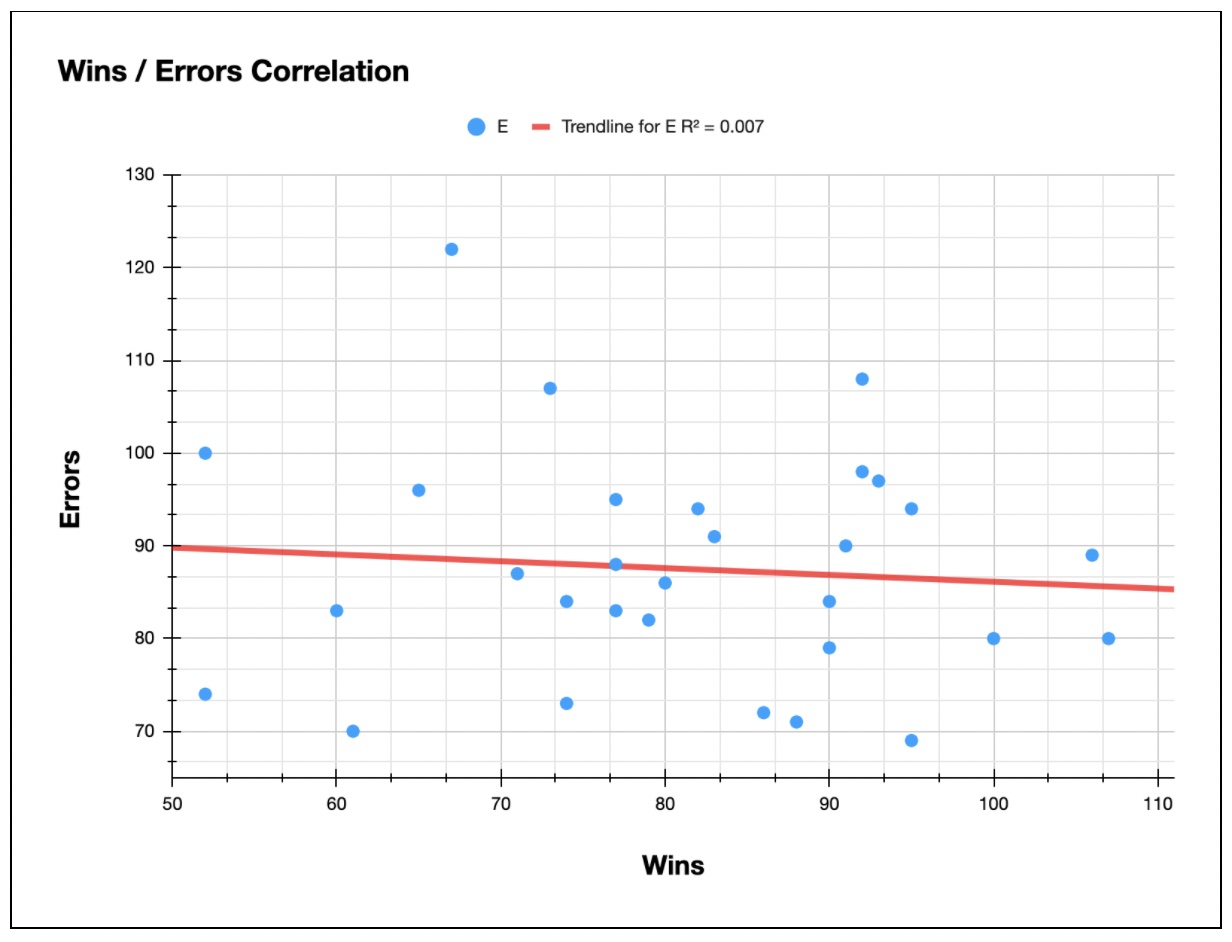
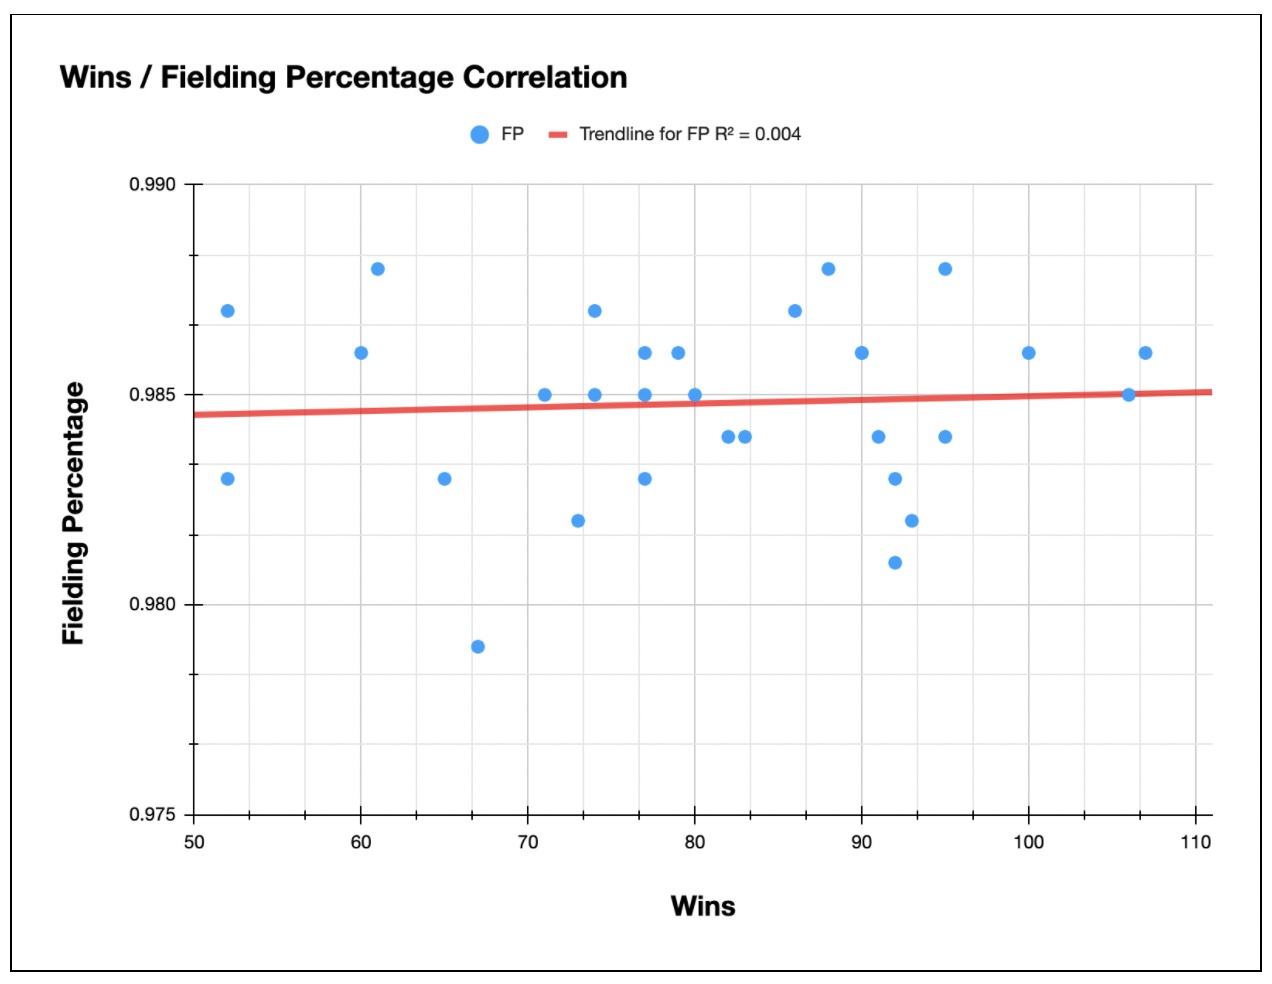
The p-value for total team errors is 0.007 which shows how little errors matter when compared to total team wins. Errors can be costly but can be afforded if runners are on base and alert. The p-value for fielding percentage is 0.004 when compared to wins. The total range of fielding percentage is between 0.979 and 0.988, which is a 0.09 difference from best to worst. With this range and p-value both being so low, it can be inferred that most teams have roughly the same fielding percentage and it contributes very little to win percentage. Looking at both error rate and fielding percentage, I concluded defensive metrics can help teams in certain situations, but do not mean much to help teams win more games.
Pitch Specifics
I did analysis on pitch type and velocity to see if those statistics had any contribution towards wins. Out of my 71 different correlations, the highest ranked pitch type or velocity statistic was cutter percentage at 41st with a p-value of 0.137. Every one of these stats were considered not correlated to wins because of their low r-squared values. Slider and curveball percentages actually had a 0.000 p-value, meaning they contributed literally nothing towards wins. These kinds of pitching statistics are solely individualistic and depend on the pitcher, not the team. For example, Baltimore had four pitchers in 2021 who threw cutters and Arizona had seven, meaning Arizona threw more cutters. Both of these teams had the same exact win percentage. Therefore, the amount of times a team throws a certain pitch does not contribute to win percentage. It all depends on the skill of the pitcher and not just what pitch they throw.
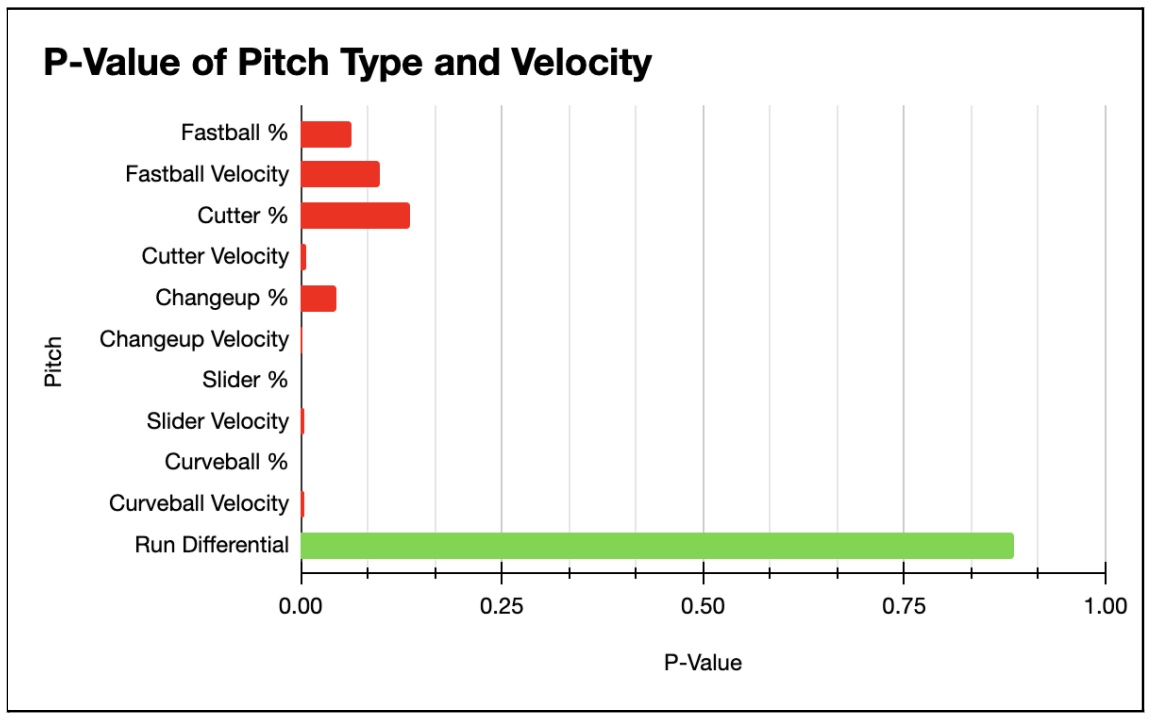
I thought velocity heavily affected at bats and above average velocity would give the pitcher a slight advantage. After analyzing pitch velocity with win percentage, I was correct about pitchers having a slight advantage. The highest correlated pitch velocity with wins was fastballs coming in at 0.099, which is not even moderately correlated. Slider, curveball, changeup, and cutter velocity do not break a 0.05 p-value. Once again, by looking at these numbers it can be concluded that the skill of the pitcher and how he uses his pitches is more valuable to the team than a team’s average velocity and pitch type percentage thrown.
Conclusion
After looking at Bill James’s Pythagorean Theorem of Baseball, I was able to discover variables other than runs that contributed more to win percentage. In conclusion, many valuable insights can be derived from comparing win totals to different offensive, pitching, and defensive statistics. Of these three, pitching has eleven out of the nineteen most heavily correlated variables when compared to win percentage. Certain hitting statistics contribute greatly to wins, just slightly less than certain pitching statistics. With all of the new rule changes for the 2022 season and the talks of even more rule changes in the future, the importance of all of these statistics could shift to be more or less significant. Adding a universal designated hitter might be the biggest present change. With all of these changes, it will be interesting to see what will happen with regards to these statistics and their importance.
Sources:
- “Major League Team Stats " 2021 " Batters " Dashboard: Fangraphs Baseball.” Major League Team Stats " 2021 " Batters " Dashboard | FanGraphs Baseball, https://www.fangraphs.com/leaders.aspx?pos=all&stats=bat&lg=all&qual=0&type=8&season=2021&month=0&season1=2021&ind=0&team=0%2Cts&rost=&age=&filter=&players=0.
- “Major League Team Stats " 2021 " Pitchers " Dashboard: Fangraphs Baseball.” Major League Team Stats " 2021 " Pitchers " Dashboard | FanGraphs Baseball, https://www.fangraphs.com/leaders.aspx?pos=all&stats=pit&lg=all&qual=0&type=8&season=2021&month=0&season1=2021&ind=0&team=0%2Cts&rost=0&age=0&filter=&players=0&startdate=&enddate=.
- “Pythagorean Theorem of Baseball.” Pythagorean Theorem of Baseball - BR Bullpen, https://www.baseball-reference.com/bullpen/Pythagorean_Theorem_of_Baseball.
About the Author: Braden Murray is a Senior Marketing and Finance student with concentrations in Data Analytics and Sports Marketing at Samford University. He is from Acworth, GA, and is an avid sports fan who cheers for the Atlanta Braves and Oklahoma Sooners.