The college football playoff is set. Four teams with four very different business outlooks. Let's take a look at each of the college football playoff teams from a business standpoint.
Alabama
The dominance of the Alabama football dynasty with Nick Saban leading his Crimson Tide to the promise land has brought quite a few dollars to the University of Alabama. By “quite a few” I mean over $95 million in income for just football. Since the Saban dynasty in football began, school enrollment has set a new record. It seems when football is at its prime then the school brings in more and more students.
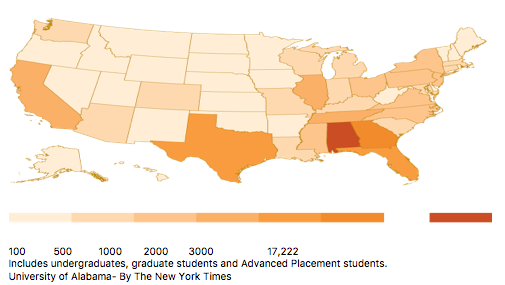
Record Enrollment in 2015
The University of Alabama has 37,100* students in 2015, the most in its history. Nearly half of them are from Alabama, and about 16.5 percent are from the contiguous states of Georgia, Florida, Mississippi and Tennessee.
New York Times states, “In 2003, the athletic budget was $37 million. Today it is $153 million. It was Mal Moore (previous athletic director) who launched and presided over the $285 million in new athletic facilities, including two expansions to Bryant-Denny Stadium that brought the seating to 101,821.” The University of Alabama is no doubt in their Golden Age of Football as well as making money.
Clemson
With the resurgence of Clemson football that Dabo Swinney has created a new era for the Clemson fans to enjoy for many years. This resurgence that has been developed also has help Clemson’s business as an athletic department.
Steven Bradley of UpstateToday.com reported the following: "Clemson University brought in $37.6 million in total revenue from football in fiscal year 2014 and turned a total profit of $16.7 million from the program, according to data the athletic department provided to The Journal. Men’s basketball was the only other Clemson sport to turn a profit among the five sports that charge admission for their games."
There were several sources of revenue.
- Ticket Sales: $17.9 million
- Distribution from the Atlantic Coast Conference: $14.8 million
- IPTAY Scholarship Funding: $2.8 million
- Concessions: $1.7 million
- Guarantees: $250,000
Ohio State
Similar to Alabama, Ohio State has one of the best college football histories in the nation. With 8 national titles and 7 Heisman winners this school has a very rich history. Now that Urban Meyer has rejuvenated the historic franchise, the school is looking at more money than ever. Its not just football, Ohio State is successful in many other sports as well. This is something that differentiates this school from the other schools in the playoff.
Each of Ohio States home games brings in around $7.15 millions. That is just in one game. Here is a graph of how they make that money in one day:
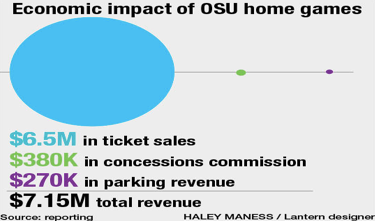
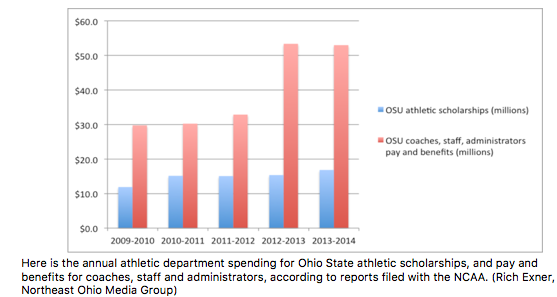
Ohio State’s Athletic department pays for itself and it shares a lot of their money with scholarships for their students as seen in the image below. The school spends about $110,000 on each of its 980 athletes, which is triple the amount the university spends per undergraduate on education.
Washington
The fourth seed in the college football playoff is a team that is similar to the Clemson tigers. Clemson has only won one title (1981) with Washington winning their last national in 1991, one of their only two. Washington has an all-time record 715–441–50 (.614) and a bowl record 18–17–1 (.514), which is oddly similar to Clemson’s all-time record 715–457–45 (.606) and bowl record 20–19 (.513).
Washington Football’s athletic department is significantly smaller than Alabama and Ohio State. Art Theil from Seattle Business magazine states: “At the University of Washington, the athletics department has a $70 million annual budget to support more than 650 scholarship athletes sustained by 219 full-time employees. And the Huskies’ operation is less than half the size of its counterpart at the University of Texas in Austin, where football has a gross domestic product large enough to be eligible for membership in the United Nations.”
Football consists of 85% percent of the budget for the whole department. The only other revenue source that makes money is the basketball team. This is similar to Clemson’s athletic department.
Conclusion
Ohio State and Alabama are the two powerhouses that are in the top 5 schools for generating the most money as an athletic department in the whole nation. Whereas, Clemson and Washington have similar histories on the football field and they also have similar revenue generating potential.
Here is a great list to show the finances behind the top athletic departments in the nation. Topping the list is Texas A&M. Ohio State comes in 3rd and is the first of the CFP teams. Alabama is 5th, Washington is 23rd and Clemson comes in at 39th.
http://sports.usatoday.com/ncaa/finances/| RK | SCHOOL | CONF | TOTAL REVENUE | TOTAL EXPENSES | TOTAL SUBSIDY |
|---|---|---|---|---|---|
| 1 | Texas A&M | SEC | $192,608,876 | $109,313,651 | $0 |
| 2 | Texas | Big 12 | $183,521,028 | $173,248,133 | $0 |
| 3 | Ohio State | Big Ten | $167,166,065 | $154,033,208 | $0 |
| 4 | Michigan | Big Ten | $152,477,026 | $151,144,964 | $263,345 |
| 5 | Alabama | SEC | $148,911,674 | $132,354,913 | $2,616,895 |
| 6 | Florida | SEC | $147,105,242 | $125,384,443 | $1,856,122 |
| 7 | LSU | SEC | $138,642,237 | $121,947,775 | $0 |
| 8 | Oklahoma | Big 12 | $134,269,349 | $123,017,251 | $0 |
| 9 | Tennessee | SEC | $126,584,033 | $113,413,325 | $0 |
| 10 | Penn State | Big Ten | $125,720,619 | $122,271,407 | $0 |
| 11 | Auburn | SEC | $124,657,247 | $115,498,047 | $4,293,893 |
| 12 | Wisconsin | Big Ten | $123,895,543 | $118,691,112 | $7,850,256 |
| 13 | Florida State | ACC | $120,822,522 | $111,386,681 | $7,073,039 |
| 14 | Kentucky | SEC | $116,494,690 | $115,159,039 | $0 |
| 15 | Georgia | SEC | $116,151,279 | $96,559,307 | $3,212,769 |
| 16 | Arkansas | SEC | $114,172,847 | $97,106,539 | $0 |
| 17 | South Carolina | SEC | $113,172,545 | $107,430,044 | $0 |
| 18 | Minnesota | Big Ten | $111,162,265 | $111,162,265 | $6,919,096 |
| 19 | Michigan State | Big Ten | $108,687,274 | $108,283,151 | $702,284 |
| 20 | Iowa | Big Ten | $105,969,545 | $109,214,651 | $650,000 |
| 21 | Oregon | Pac-12 | $105,701,523 | $103,880,557 | $2,009,125 |
| 22 | Louisville | ACC | $104,325,207 | $101,624,437 | $7,139,281 |
| 23 | Washington | Pac-12 | $103,540,117 | $104,403,253 | $3,895,000 |
| 24 | Nebraska | Big Ten | $102,157,399 | $98,023,037 | $0 |
| 25 | UCLA | Pac-12 | $96,912,767 | $96,912,767 | $2,668,512 |
| 26 | Oklahoma State | Big 12 | $95,931,739 | $93,144,396 | $7,795,211 |
| 27 | Maryland | Big Ten | $92,686,128 | $92,558,535 | $14,546,411 |
| 28 | Kansas | Big 12 | $91,860,673 | $92,207,877 | $1,960,129 |
| 29 | Virginia | ACC | $91,256,772 | $91,345,925 | $13,555,431 |
| 30 | Missouri | SEC | $91,217,778 | $86,859,158 | $1,515,000 |
| 31 | West Virginia | Big 12 | $90,523,565 | $87,265,473 | $4,403,165 |
| 32 | North Carolina | ACC | $89,128,256 | $89,080,843 | $9,040,407 |
| 33 | Indiana | Big Ten | $88,362,421 | $88,330,530 | $2,707,752 |
| 34 | Mississippi | SEC | $87,602,519 | $82,399,898 | $1,995,752 |
| 35 | Arizona | Pac-12 | $87,135,331 | $80,706,045 | $8,965,277 |
| 36 | Illinois | Big Ten | $85,998,659 | $87,163,188 | $3,728,444 |
| 37 | California | Pac-12 | $85,539,904 | $94,016,545 | $1,252,719 |
| 38 | Arizona State | Pac-12 | $84,440,040 | $83,873,516 | $19,379,132 |
| 39 | Clemson | ACC | $83,534,371 | $82,855,674 | $4,190,747 |
Written By: Kennedy Buettner
General Editor: Macy Marin