How Analytics are Driving Changes in Coaching Decisions
In baseball, there is nothing more honorable than giving yourself up for the greater good of your team. The sacrifice bunt epitomizes the team concept and is properly executed when a player lays down a bunt (with 0 or 1 out) to advance their teammate(s) 90 feet while getting retired at first base. If you played baseball at a young age you probably heard your coaches say “On, over, in!” which is a phrase that has been uttered across baseball diamonds in many languages around the world. At lower levels of baseball, this makes a bit more sense as the chances of a youth player fielding a well placed bunted ball cleanly and throwing out a runner is relatively low. However, as you climb up the ranks in organized baseball, fielders get better and the sacrifice almost always ends with the batter sacrificing himself and returning to the dugout. Once back in the dugout the player is normally greeted by his teammates congratulating him on getting the job done. However, statistically speaking, the sacrifice bunt really does not help your team produce more runs in most situations.
Sacrifice Bunts Are a Bad Idea?
The fact that bunts don't help can be illustrated by the run expectancy matrix illustrated below taken from http://www.tangotiger.net/re24.html which is an incredible website where you can learn a great deal about baseball analytics. In the matrix, we can see the data taken is from the 2010-2015 Major League seasons. A quick guide to how the matrix works: each decimal below the corresponding out shows the number of runs “expected” in each situation for the corresponding inning. For example, if you were to have the bases loaded and 0 outs you are expected to score 2.292 runs by the end of that half inning. If you have nobody on and 2 outs you are expected to score 0.098 runs.
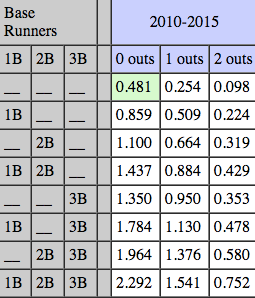
If the leadoff man hits a single the run expectancy is at 0.859 for the inning. So if the following hitter decides or is instructed to “sacrifice” himself and he is retired at first and the runner advances your expected run total for that inning drops to 0.664! Let’s look at another situation where a sac bunt can be implemented, runners on 1st and 2nd and less than two outs. With 0 outs you are expected to score 1.437 runs and with 1 out .884 runs. After the sacrifice bunt occurs your run totals drop to 1.376 (one out) and 0.580 (two outs). Once again we see that the expected run total is not benefitted from the bunt.
When is a Sacrifice Bunt Helpful?
This is not to say that there is no merit in the sacrifice bunt. There are many situations where this is the proper play and usually occurs when a pitcher is up to bat and instead of letting him swing away. The best hitting MLB pitchers typically reach base 25% of the time while average pitchers are closer to 15%. Also, of course, there are situations late in the game where you are trying to get the tying/winning run across the plate. In these situations, a coach might be willing to reduce the odds of having a big inning in order to increase the odds of tying the game.
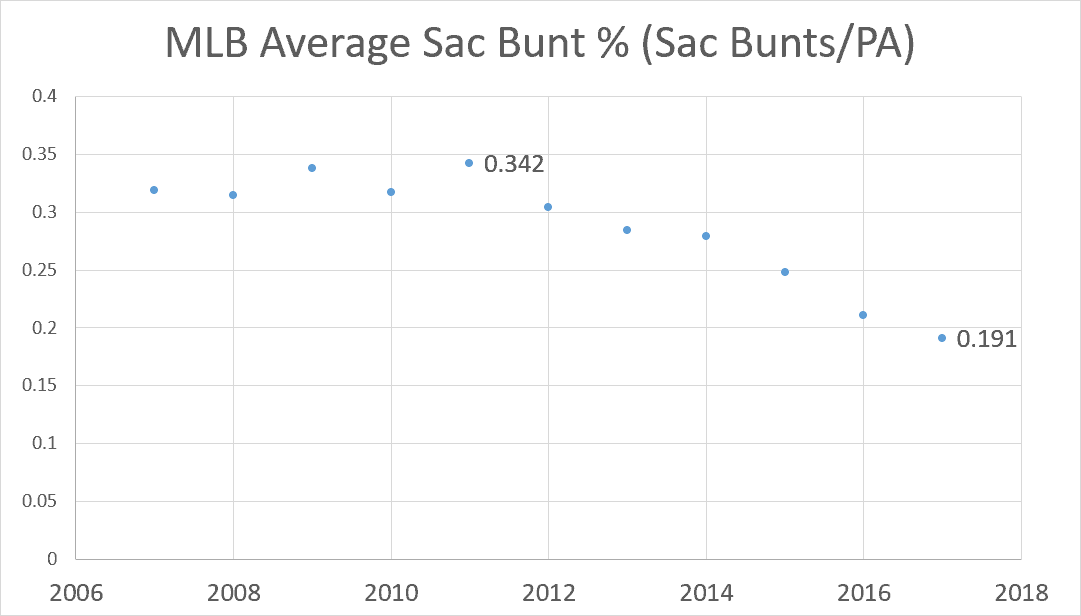
It is safe to say that teams are more privy to data than ever before and are using this data to make informed decisions on events throughout the game. According to the below chart, the sacrifice bunt is a dying art form in Major League Baseball.
The Value of an Out
The sacrifice hit is certainly trending downward as you can see by the data points highlighted that represent the 2011 (0.342) and 2017 (0.191) seasons. The explanation behind this is the fact that teams are starting to value outs now more than ever and are more averse to giving them away. In 2017, National League team’s (where pitchers hit) make up nearly 70% of all sacrifice hits while the American League team’s make up the additional 30%. It is also interesting to note that the Houston Astros, home of the best record in the AL, have the fewest percentage of sacrifice hits (0.06 %) and are thought of as one of the most data driven teams in baseball. Ten years ago, before the use of advanced analytics, this same Astros ball-club (while still being in the NL) were 2nd in baseball with 0.49% sacrifice hits. As data becomes more and more prominent in baseball, I think we will continue to see the sac bunt numbers continue to fall.
Author:
 Steven Goldberg is a recent graduate from Lehigh University with a degree in Economics. Steven is pursuing a job with an MLB team for the 2018 season.
Sources:
“MLB Team Sacrifice Hits per Game.” MLB Stats – MLB Team Sacrifice Hits per Game on Teamrankings.com, Team rankings LLC, 2017, www.teamrankings.com/mlb/stat/sacrifice-hits-per-game.
Tiger, Tango. “Run Expectancy.” Run Expectancy Matrix, 1950-2015, www.tangotiger.net/re24.html.
Images courtesy of the Southern Conference