Where is the Defense?
Over the last decade, defense has taken a backseat to offense in Major League Baseball from a managerial perspective. Offensive statistics drive everything from draft picks, all star selection, and MVP voting. As a result, baseball analysts have developed every statistic imaginable for offensive data, from traditional stats like batting average and slugging percentage, to more recent developments such as OPS+. Even as the idea of a stat for WAR (Wins Above Replacement), individual stats to show just how good a player was defensively compared to his peers seemed to be elusive.
Statcast
The wait is over. Within the last month, Statcast has introduced the new metric OAA (Outs Above Average). This metric displays how much better or worse an MLB player is in field compared to the average Major League player. This metric was made possible with Statcast’s recent introduction of “Catch Probability.” This measures the probability that a ball can be caught from 1% (virtually impossible) to 99% (a ball that should be caught every time) with 1%-25% identified as 5-star catches, 26%-50% as 4-star, and so on until you reach a 1-star catch at 99%. Now that Statcast has a quantifiable number associated with each fly ball that is caught, they can measure who is officially the best at catching fly balls.
An example of how OAA is computed: Byron Buxton recently made a diving play on a fly ball in left-center field. This turned out to be a 4-star catch, according to Statcast. This means that the average player would miss this ball 76% of the time. For this catch, Buxton received +.76 points towards his OAA. Had he missed it, he would have gotten -.24, because the average outfielder would make the play 24% of the time. For an easy 99% catch, the fielder receives +.01 for a catch, and loses -.99 if they drop it.
Why Buxton is the Best
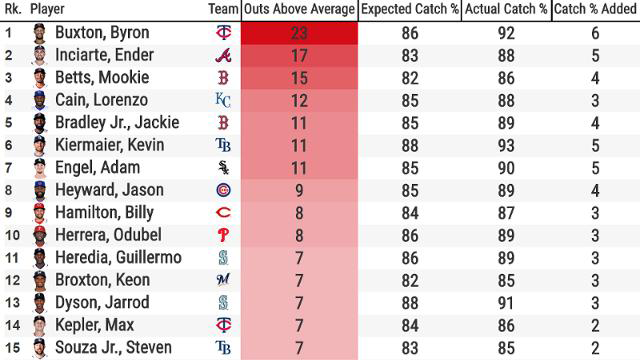
With this in mind, it is easy to see that Byron Buxton is by far the most valuable outfielder in the Major Leagues this season, at least from a defensive perspective. In the image below we can see that Buxton has recorded 23 outs more than the average player would have in his same position with the same fly balls hit to them. That number is 6 more outs than the second place outfielder has caught. What is even more advanced about this statistic is the way that is accounts for the difficulty of the plays. In the column labeled “Expected Catch%” we can see the percent of the fly balls hit into the area of this player that the average fielder would catch. One more column to the right of that shows the actual number of balls in his area that the real player made the play on. The lower the Expected Catch%, the harder the fly balls that player is getting. This shows that Buxton catches 6% more fly balls than the average player.
This metric of OAA will truly change the game of baseball and how it is measured. As more data is being pumped into the sport, teams have started to place more of an emphasis on defense, realizing that it is more valuable to saving runs than hitting average amounts of homeruns are valuable in creating runs. The team leader for the MLB is the Twins with 29 OAA this year. Yes, Buxton has helped with that number, but I don’t think there is any coincidence that, as stated earlier, when there is a throw and catch in every play of the game, the teams that catches it better than any other is in the playoffs.
 Written by: Sam Teague
Sam Teague is a senior at Samford University, majoring in Marketing with a concentration in Sports Marketing. He is also a letterman on the baseball team at Samford. Sam is interested in pursuing a career in sports business after graduation.
Source
http://m.mlb.com/news/article/253726830/byron-buxton-leads-statcast-outs-above-average/