If you step on a college campus it quickly becomes obvious the route students take to get to class. There is usually a well-worn dirt path carved into the grass or through a flowerbed where students have taken the shortest route possible. In this case, it is obvious where the next sidewalk or bike path needs to be built; facilities management just paves over the paths the students have laid out for them. When it comes to city planning for bike paths and other public works, next steps are often less obvious and data collection is a daunting process. In the past, as an Oregon city planner named Sheila Lyons notes in an article from The Guardian, the data collection process for bike counts was rudimentary at best. Volunteers would sit on street corners for two-hour periods, once a year, and count the number of cyclists that rode by them. Now, with the advent of big data and the help of a popular cycling and running app called Strava, life is a lot easier for urban planners.
How Strava Is Changing the Game
Strava is a social network for athletes that allows them to track their activities through a mobile app on their phone or on a GPS device. Athletes can then share their activities to their followers on the social network. It is most commonly used by cyclists and runners, but users can track everything from swimming to cross-country skiing. All this activity has produced a wealth of data and in 2014 Strava released its first global heatmap of recorded activities. Strava started this as a fun project for its engineers and users, but so much interest came from city planners requesting the data that a subsidiary of Strava was launched called Strava Metro.
The most recent version of the heatmap was released to the public in November 2017 and it shows all recorded activity in the cycling, running and swimming categories since the launch of the app in 2009. Strava stated, in its official press release, that the new heatmap contains over 1 billion activities, 200K hours of data, and it covers 5% of all land on Earth. City planners can request data specific to their area at a price of $.80 per Strava member (per year) within their city; which is relatively cheap compared to other methods of data collection. Strava data is unique because users are actively uploading useful data without the prompting of city planners. If someone tried to create a city planning app it would not be nearly as successful as an app like Strava where users are already uploading their rides and runs on their own accord. What makes Strava data so valuable is that city planners can target specific streets and see very detailed subsets of anonymous information like gender, age, time, distance, and repetition of activity. Collecting that kind of information by hand would be nearly impossible, but with Strava Metro it is easy.
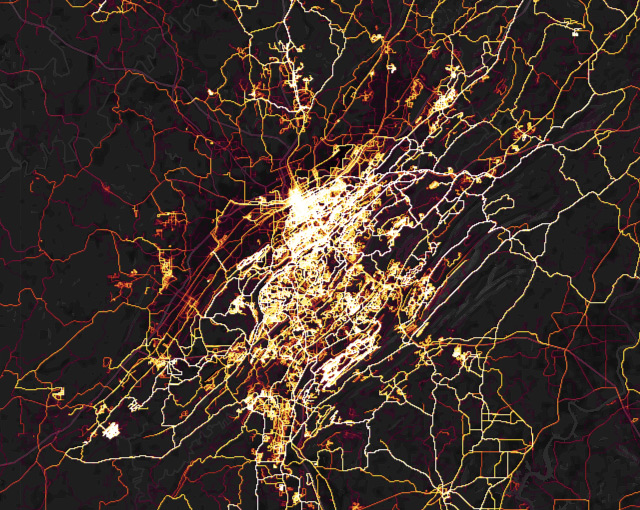 Heatmap of Strava activity in Birmingham, AL
The Good and the Bad
Strava Metro data has led to the success of projects like the Tilikum Crossing bridge in Portland, Oregon. This unique bridge does not allow cars, only public transportation, and was specifically designed to accommodate cyclists and pedestrians. Other projects like Austin B-Cycle, a bike-share program, in Austin, Texas and the huge networks of bike and pedestrian paths in Queensland, Australia have utilized Strava data in their construction and implementation. Strava says that as of 2016 over 100 municipalities were utilizing Strava Metro.
Despite its usefulness, the data is not without its faults. Many users on Strava are avid amateur and professional cyclists and they do not represent the large portion of cyclists that ride bikes for commuting and casual use. While it is estimated that Strava data makes up only 5-10% of all bike movements, cities still consider this a significant number and note that avid cyclists tend to use similar routes as commuters. Strava has tried to improve the input of data with a recent social campaign called #CommutesCount and the option to tag rides as commutes within the app. Given the holes in the data, many city planners note that it is best to use Strava as a “piece of the puzzle” and combine it with other forms of data. The Oregon DOT even uses Strava to decide where to place bike counters that are collecting data by hand. While imperfect, the data is still extremely valuable and is having a great impact on the way governments look at city planning.
Looking to the Future
Strava Metro came into being almost by accident, but it stands to improve the lives of all parties involved. Michael Horvath, a co-founder of Strava, sees Strava Metro as a good investment. He notes that if Strava is willing to share its data, then roads and bike paths improve, which leads to more people riding bikes, which leads to more people downloading the app, which leads to more data, and so on. Mark Shaw, the Chief Technical Officer at Strava, sees some exciting future uses for the data as well. He thinks that one day cities can use Strava for real-time traffic planning and there is also the potential for cyclists using Strava to send warnings to nearby drivers. The options for the utilization of Strava data are limitless and that is great news for athletes around the world.

This blog post was written by Samford University student Grant Gardner. Grant is a marketing major with a concentration in sports marketing and minor in sports media. Learn more about Grant on LinkedIn and Twitter.
Sources
Better Data for Better Cities. (n.d.). Retrieved from: https://metro.strava.com/
Eldredge, Barbara. (2016, September). How a fitness app for cyclists is reshaping city planning. Curbed. Retrieved from: https://www.curbed.com/2016/9/2/12749686/cycling-city-planning-app-strava
Libby, Brian. (2015, October). The Bridge That Bans Cars. The Atlantic. Retrieved from: https://www.theatlantic.com/magazine/archive/2015/10/the-bridge-that-bans-cars/403234/
Robb, Drew. (2017, November). The Global Heatmap, Now 6x Hotter. Medium. Retrieved from: https://medium.com/strava-engineering/the-global-heatmap-now-6x-hotter-23fc01d301de
Tan, Zhai Yun. (2016, May). Your Workout Data Might Be Helping Cities Build Safer Streets. NPR. Retrieved from: http://www.npr.org/sections/alltechconsidered/2016/05/07/476651753/your-workout-data-might-be-helping-cities-build-safer-streets
Walker, Peter. (2016, May). City planners tap into wealth of cycling data from Strava tracking app. The Guardian. Retrieved from: https://www.theguardian.com/lifeandstyle/2016/may/09/city-planners-cycling-data-strava-tracking-app
Walker, Rob. (2017, April). What App Data Can Do for City Planners. City Tech. Retrieved from: https://www.lincolninst.edu/sites/default/files/pubfiles/city-tech-lla170402.pdf
Strava logo published with the permission of Strava, Inc.