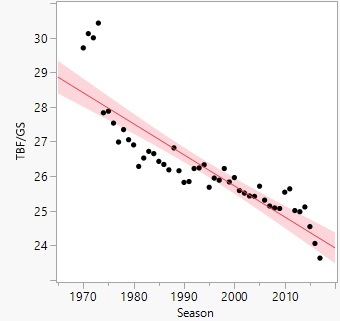
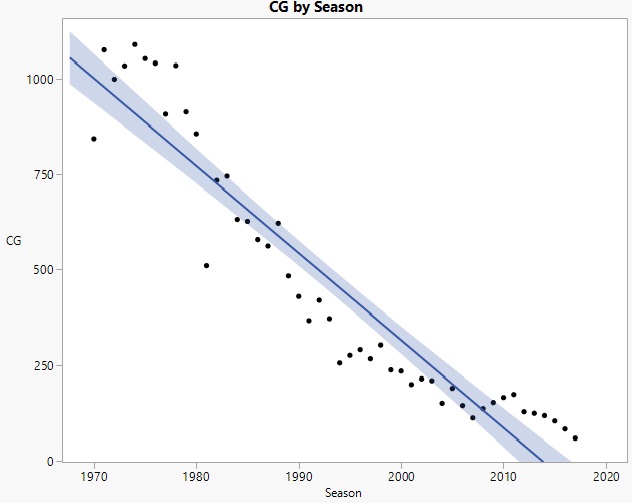
Total Batters Faced per game by starting pitchers has taken a slow, but certainly steady decline for nearly 50 years and is shown in the graphic below to the left with the red trend line. The peak here is at 30.4 TBF/GS in 1973 and comes all the way down to 23.6 TBF/GS in 2017. The next graphic with the blue trend line shows complete games by season. Letting pitchers get deep into games was a lot more prevalent in past seasons with a similar trend line to the previous graph. The steady decline in both shows that managers are taking the ball from starters a lot earlier and a lot more often.
Where Are the Innings Going?
While ranking the league’s best bullpens before the season, Travis Sawchik notes just how important this part of the team is, citing the increase of usage: “Last season, bullpens accounted for a major-league record 38.1% of total innings thrown, up three percentage points (35.1%) from 10 years earlier. In 2017, relief pitchers beat their previous record for workload — set the previous season — by 578 innings. Thirty years earlier, bullpens accounted for 31.8% of innings; 50 years earlier, for 26.0%” (Sawchik, 2018). This trend has been a constant. As the MLB has completed close to 10% of its games, as of April 16, 2018, bullpens have accounted for 41% of innings pitched and are on pace to set the record by 962.2 innings. The 3% jump between 2008 and 2017 is about the same as the jump over the past year, nearly doubling the increase in usage between the 2016 and 2017 seasons. There has obviously been a shift in baseball towards excessive bullpen use and it bears intriguing results based on its level of success.
How Effective Is It?
As I’ve just noted, last year was a league record in bullpen usage, so you would expect that to mean it worked, right? In this case, it didn’t. Along with the innings logged, wOBA against relievers has been on the rise for a few years and was up to .311 compared to .309 in 2016. SLG % also jumped to .403 from .396 in 2016. And lastly, Fielding Independent Pitching (FIP) was up to 4.27 from 4.10 the year before. The decrease in efficiency would leave me to believe teams would shy away from more bullpen use, but with the huge increase in bullpen usage and its pace for the 2018 season, their effectiveness has gone up. This year, wOBA is down as low as .303, the lowest it’s been since .302 in 2014. SLG % is down to .369 which is lowest since .368, again in 2014. As for the most important statistic, FIP is down to 3.89 which is also the lowest it’s been since 2014, in which relievers pitched to a 3.67. The biggest takeaway from this, is the difference in usage between what relievers are on pace for in 2018 and what 2014 came out with. In 2014, relievers pitched 14621.2 innings and in 2018, relievers are on pace to pitch 17432.1 innings. With a difference of close to 300 innings, relievers are pitching to virtually the same run prevention and effectiveness as 2014’s smaller usage.
What Makes FIP Important?
Fielding Independent Pitching is a statistic used to calculate what a pitcher’s performance looks like without balls in play; Using this statistic keeps the variation of balls falling in for hits and fluctuation of Batting Average on Balls in Play (BABIP) out of the output. The equation looks like this: 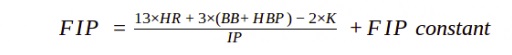
The “FIP constant” calculates the league average FIP and subtracts is from the league average ERA. What makes FIP so interesting and more important in recent years is that it focuses on the Three True Outcomes; Home runs, walks, and strikeouts (Disclaimer: Hit by pitches (HBP) are not included in the Three True Outcomes, but are included in FIP calculation). In 2017, MLB relievers recorded the highest K/9 ever with 8.9 and are on pace to break that record again at 9.2, based on the first 10% of the season. In 2017, BB/9 for relievers was down to 3.6 and so far, this year they are on pace to increase to 3.8. Finally, last year saw a year for the ages regarding home run hitting, including a record setting 1.3 HR/9 for all pitchers and 1.2 HR/9 for relievers. To this point in 2018, relief pitchers have cut down to a rate of .95 HR/9. So as the game progresses and these Three True Outcomes become more and more frequent, thanks to the most home runs and strikeouts in league history and a top 10 all-time finish in walks, it makes sense to pay more attention to the FIP statistic. Last year saw an astonishing 36.4% of all batters faced by relievers end in one of the Three True Outcomes and this year is also on pace to surpass that with a rate of 37.3%. With more than a third of plate appearances for relievers ending in a home run, walk or strikeout, its significant to pay attention to this statistic and how it impacts managers’ decisions to use the bullpen.
Sources
“Fangraphs Leaderboards.” (2018) Fangraphs, Retrieved April 16, 2018 from
www.fangraphs.com/leaders.aspx?pos=all&stats=bat&lg=all&qual=y&type=8&season=2017&month=0&season1=2017&ind=0
“FIP.” (2018) Fangraphs, Retrieved April 16, 2018 from
https://library.fangraphs.com/pitching/fip/
“2018 Positional Power Rankings: Bullpen (1-15).” (2018) Fangraphs, Retrieved April 16, 2018 from https://blogs.fangraphs.com/2018-positional-power-rankings-bullpen-1-15/
About the Author
 Rory Houston is a Junior at Saint Joseph's University double majoring in Business Intelligence and Analytics & Sports Marketing, looking to pursue a career in baseball.