It’s no secret that the attendance in stadiums around Major League Baseball has been in decline in recent years. In 2017, MLB recorded the lowest total attendance (72,670,423) since 2003 (67,630,052). It has also dropped two million in overall attendance since 2013. On the other hand, some teams have thrived in the same time. In 2017, the Dodgers recorded their highest total attendance (3,765,856) since 2014 and that marked their fifth straight year of attendance over 3,700,000 fans. A feat that no other team has accomplished. Whether it’s due to the declining interest in baseball, the extreme season of weather that has started the 2018 season or poor support in a given team’s market, the attendance around the league is fluctuating.
Weather
Through May 28th, the 2018 season has recorded two million less total fans then were recorded last season in the same time. Just nineteen days into the new season and twenty-four games around the league had already been cancelled. According to The Associated Press the 2018 season, "matched 2007 for the most weather-related postponements through April since Major League Baseball started keeping records in 1986." That number was also reached just over halfway through April and although no total number has been recorded for May yet, Major League Baseball may be in for another record.
It’s not just the postponed games, it’s the brutal conditions that teams are having to play in as well. On April 8th, the Cleveland Indians played the coldest game ever in the 25-year history of Progressive Field (32 degrees). The attendance at that game was 14,240, well below their season average of 18,497.
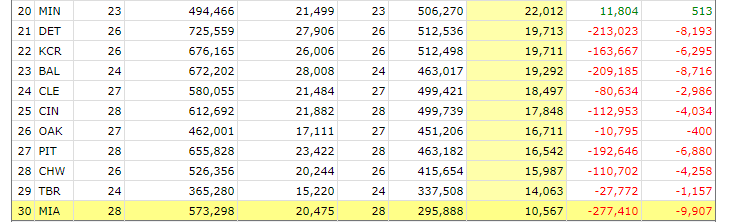
It’s not a coincidence that of the ten lowest teams in terms of attendance per game (Attend/G), eight of the teams play in the North or the Midwest, two of the places hit hardest by this long winter.
Baseball-reference
As you can see in the chart, many of those teams are experiencing the biggest drops in Attend/G as well this year (all numbers based off 5/28/18 vs 5/28/17). The Marlins, Orioles, Tigers and Pirates rank 2nd – 5th in biggest drops in Attend/G. Except for the Marlins, the other teams show that fans are not willing to sit through those conditions to watch baseball.
Attendance Drops Throughout the League
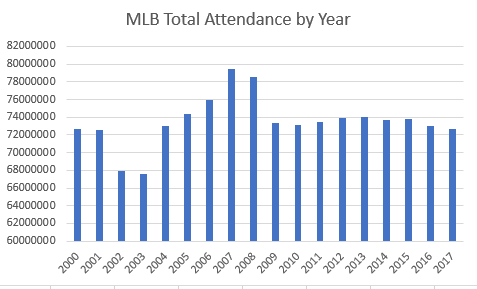
I’d like to keep the following MLB attendance analysis from the 2000 season and on. The reason is that most teams did not have the seating in their stadiums that there is now and that would skew the figures tremendously.
The 2017 season marked the fourth lowest attended season since 2000, only ahead of 2001, 2002, and 2003. That makes the 2017 season about 8.5% lower than the highest attended season since 2000 (2007), although in fairness 2007 was the highest attended season on record followed by the second highest attended season. More recently however, MLB attendance is only down about 1.4% since 2015, for an entire professional sports league that number is not too concerning.
Market Support
I believe the real issue with the attendance in Major League Baseball is within the individual markets themselves. Since 2000, only five teams have led the league in total attendance, the Yankees (8), Dodgers (6), Phillies (2), Mariners (1) and Indians (1). On the flip side, since 2010 only three teams have vied for lowest attendance, the Rays (6), A’s (1) and Indians (1). Tampa Bay is the only team to not break two million total fans since 2010 and they haven’t broken 1.5 million fans since 2013.
Since 2010, the three highest teams in total attendance are the Dodgers, Yankees and the Cardinals. The three lowest teams are the A’s, Indians and Rays. Forgoing the differences in stadium capacity, there is a clear difference in these markets and the support each one has. In 2017, the Cardinals filled 96.8% of their home seats during the season, the Dodgers 83% and the Yankees 80.2% (2nd, 5th and 8th in the league respectively). On the other hand, Cleveland only filled 58.2% of their stadium during home games, Oakland 52.6% and the Rays only managed 45.6% capacity (21st, 28th and 30th). Areas that want baseball will avidly support it, teams in markets without support will continue to skew attendance numbers.
Works Cited
ballparksofbaseball.com
baseball-reference.com
cleveland.indians.mlb.com
espn.com
ipfs.io
si.com
usatoday.com
About the Author
 Patrick is a rising senior attending Western Carolina University with a double major in sports management and computer information systems. He loves to study data trends related to the business of sports as well as in athlete performance. He hopes to one day work in the sports industry after graduation.