College sports is big business! As a result, universities are increasingly hiring new athletic directors based on their business background rather than coaching experience. So, what is the key to growing the revenue for a college football program? The following article reports the findings of a study that seeks to answer that question. And the answer might surprise you!
Year end and year out the same teams dominate the lists of college football teams that generate the most revenue. Alabama. Texas. Michigan. Notre Dame. Oklahoma. These teams benefit from their rich histories as much as they do from their team success year in and year out. All college athletic departments are required to file information about their expenses and revenues generated by each team due to the Equity in Athletics Disclosure Act (EADA). The U.S. Department of Education posts all of this data on their website and it is accessible to the public. I was gathering this data for a different project, but I was interested in how the financials would relate to other variables like team performance and attendance. For the 2016 college football season, 125 Division I FBS teams reported their information, and this served as my sample. Below is a correlation plot of the different variables for these 125 teams.
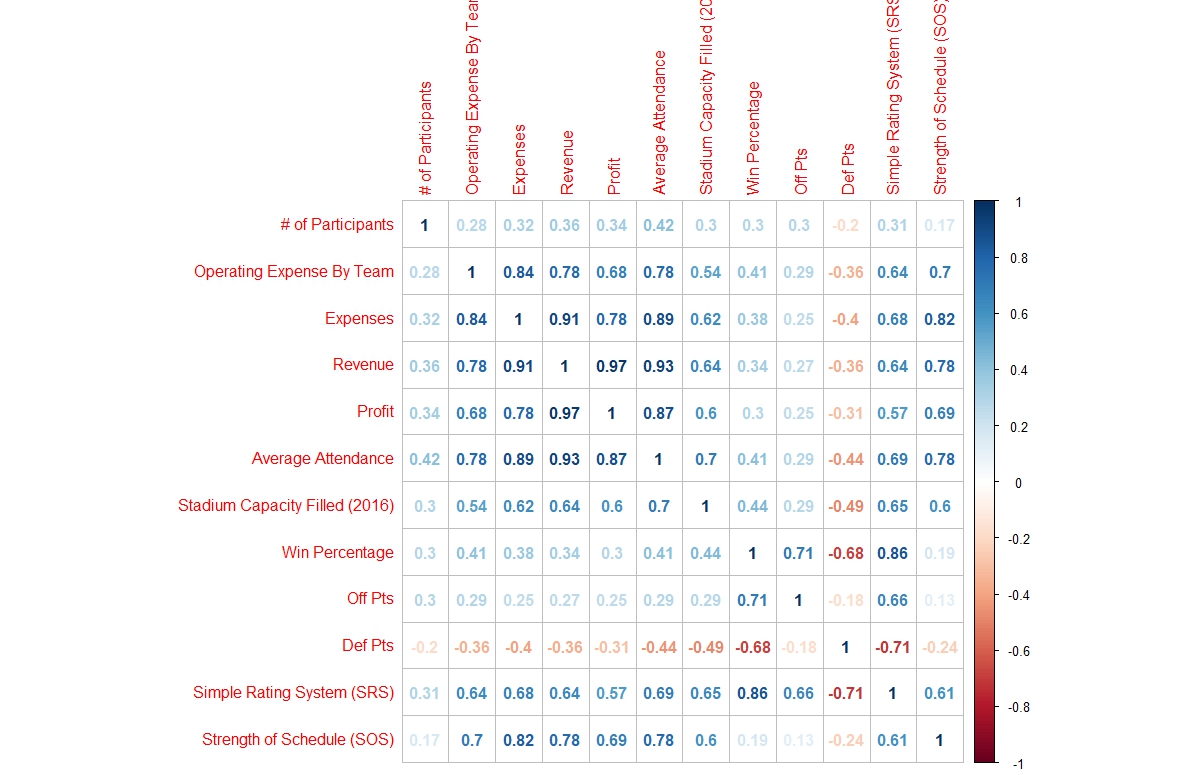
A correlation plot shows the correlation coefficient (r value) between all numeric variables that are analyzed by the plot. The closer the number in the box is to 1 (positive correlation) or -1 (negative correlation), the stronger the linear relationship between the two variables. If the number is near zero, there is little to no correlation. Some variables that stand out as having interesting correlation coefficients are the average attendance, simple rating system, and strength of schedule having such strong relationships with the financial variables.
SOS & SRS
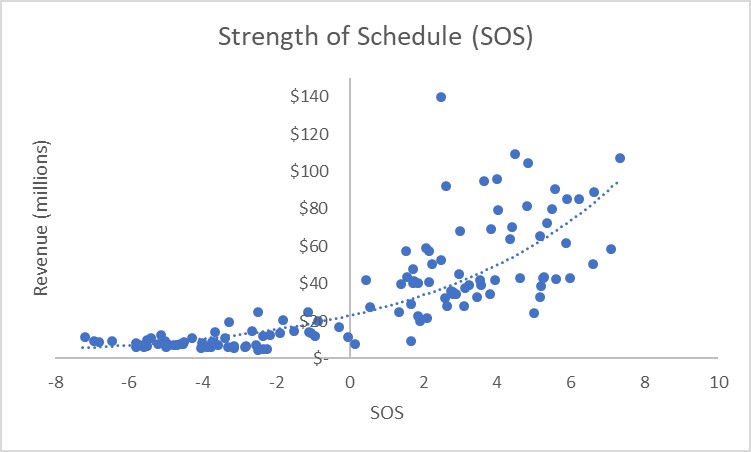 Two variables that had some of the highest correlation coefficients in the plot were the strength of schedule (SOS) and simple rating system (SRS). Both stats come from College Football Reference. SOS is a rating of the strength of opponents played whereas SRS is “a rating that takes into account average point differential and strength of schedule” (College Football Reference). The SOS metric considers 0 to be an average strength of schedule. When plotting Revenue against SOS, it appears to follow more of an exponential relationship than linear. There is not much growth in revenue until the strength of schedule is higher than zero, or above average. When schools schedule and play against better quality teams, it could bring in more fans and increase revenue.
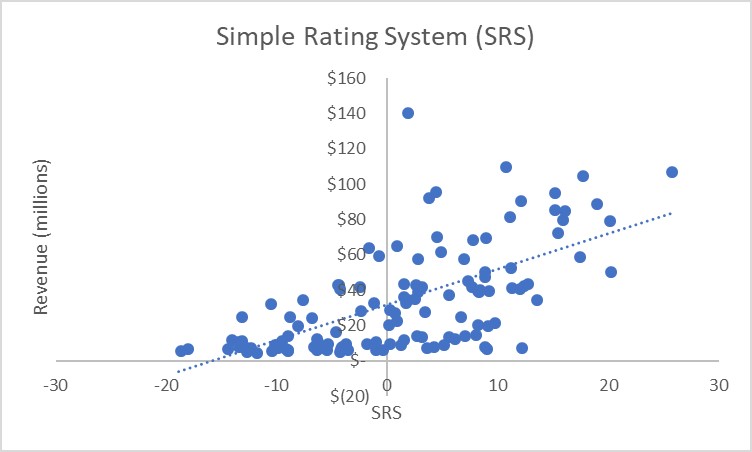 The simple rating system does not appear to be as good of a fit for a linear or exponential relationship as the SOS or average attendance. SRS had Western Michigan rated as the 15th best team, but they only generated $8.7 million in revenue and were 105th in SOS. Many of the low revenue teams on this plot have SRS scores greater than zero. Teams from outside the Power 5 Conferences can be rated highly by this metric because of their large point differential which can overcome a weak strength of schedule. However, it is difficult for them to compete with the bigger programs in terms of money making in a year to year basis. The school to make the most money outside of the Power 5, excluding independent programs Notre Dame and BYU, was the University of Connecticut at $25.9 million which ranked 63rd out of 125 institutions. Since the Power 5 schools are normally the best teams and have higher SRS scores, in general, the better an SRS rating, the greater the revenue.
Average Attendance
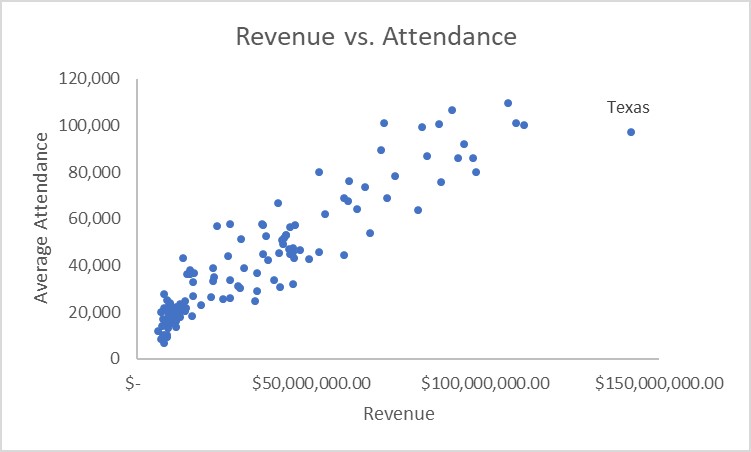 One of the strongest correlation coefficients on the plot was between revenue and average attendance in stadiums at 0.93. This suggests a strong, positive linear relationship and the scatterplot backs this assertion. The only point that may be a significant outlier is the University of Texas that made more than 30 million more dollars in revenue than the next closest team. In general, the more people that go to games, the more revenue a school will bring in. This makes sense, since the schools that make the most money can afford to build large, new stadiums that seat as many fans as possible that want to come support their team. It’s more likely that high revenues lead to a larger stadium/more fans as opposed to a bigger stadium creating higher revenue.
About the Author
 Nick Tice is a rising junior at the University of South Carolina double majoring in Statistics and Sports Management. He is looking to pursue a career in NBA analytics after graduation.
Works Cited
2016 Standings. (n.d.). Retrieved July 17, 2018, from https://www.sports-reference.com/cfb/years/2016-standings.html
Equity in Athletics. (n.d.). Retrieved July 17, 2018, from https://ope.ed.gov/athletics/#/
Hart, A. (2013, August 11). Green Island in a Sea of Blue. Retrieved July 19, 2018, from https://www.flickr.com/photos/andrewfhart/9487931632/
Solomon, J. (2016, December 16). College football attendance in 2016: Crowds decline for sixth straight year. Retrieved July 17, 2018, from https://www.cbssports.com/college-football/news/college-football-attendance-in-2016-crowds-decline-for-sixth-straight-year/