
The bullpen revolution is here to stay. The only problem with it is that there is currently no way to truly measure how valuable relievers actually are. When looking at Wins Above Replacement (WAR), relievers are severely undervalued and barely make an impact on the leaderboards in this regard.
How Undervalued Are They?
Just last year, we had an outstanding season performance from Los Angeles Dodgers closer Kenley Jansen, ranking 22nd all-time in WAR during a single season from a reliever; His Wins Above Replacement was 3.6. This was less win shares than both Jeff Samardzija (3.8) and Jose Quintana (3.9) who pitched to 4.42 and 4.15 ERAs, respectfully. Jansen blew one save and converted the other 42 successfully, but still finds himself valued less than starting pitchers who were mediocre at best. How is this possible? Jansen simply does not get enough opportunity to contribute to his team as starting pitchers around the league do. A few seasons back, Dave Cameron broke down relievers and their relationship with the statistic perfectly; “While the quality of their work is very high, the quantity is low, which limits their total value” (Cameron, 2018). The key word here is quality, which forces us to look at context, like Leverage Index.
All About Leverage
To calculate Leverage, “You take the current base-out state, inning, and score and you find the possible changes in Win Expectancy that could occur during this particular plate appearance. Then you multiple those potential changes by the odds of that potential change occurring, add them up, and divide by the average potential swing in WE to get the Leverage Index” (Fangraphs, 2018). There are a few different variations of Leverage; pLI is a pitcher’s average leverage in all game events, gmLI is a pitcher’s average leverage when entering game, and exLI is a pitcher’s average leverage when exiting a game. To compare starters and relievers on a different playing field other than WAR, I used some of these advanced metrics. I’ve chosen to look at a starters pLI and relievers gmLI when comparing to the two. It makes sense to use gmLI for relievers because it is a league wide consensus that relievers enter games in their designed roles similar to how starters enter games in their designed roles, at the start of the game. Because entering a game in the first inning is always a low leverage situation, I used pLI for starters, to give them a chance to work into higher leverage situations. To show how often their high leverage comes up, last year’s 153rd highest average gmLI for relievers, Derek Law, is higher than the highest average pLI for any qualified starting pitcher, Luis Perdomo. The average pLI for starters was .92, far less than the average gmLI for relievers at 1.07. That average gmLI for relievers was slightly above Luis Perdomo’s 1.06 average pLI. It is an undisputable fact that relievers face bigger, game-changing moments on a far more regular basis than starters.
Visualizing the Difference
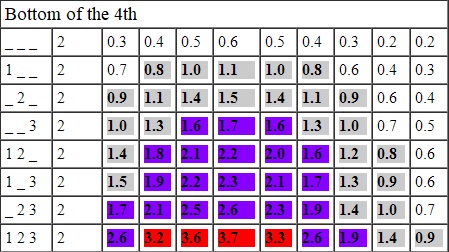
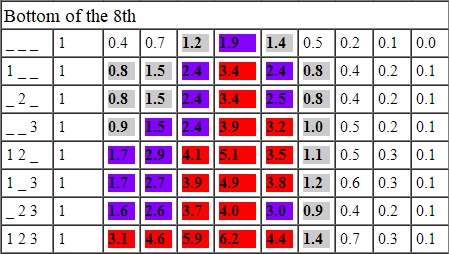
Looking at the tables below, it shows the leverage for a certain inning, out, score and men on base situation with its corresponding leverage. They are color coated with white for “low-leverage”, grey for “medium leverage”, blue for “high leverage” and red for “very high leverage”. The middle column represents a tie score and -/+ 4 runs on each side. The bottom of the 4th with 2 outs and the bottom of the 8th with 1 out, is to signify a situation that a starting pitcher and a relief pitcher might be in, respectively. The situations in the bottom of the 8th have 4 times as many very high leverage situations as the bottom of the 4th. There’s a clear intensification and an increase in the need for perfection out of the pitcher to keep his team in the game.
No matter which way you look at it, relief pitchers are extremely important to a team’s success. There is no doubt that what starting pitchers do is important for the team, but the urgency in the situations in which relievers pitch are of far greater magnitude than the beginnings of games. Although it may not show up in major statistics like WAR, relievers’ value is definitely felt each and every game as the moment gets bigger.
Works Cited
Cameron, D, (2018). WAR and Relievers. Retrieved May 3rd, 2018 from https://blogs.fangraphs.com/war-and-relievers/
Fangraphs, (2018). LI. Retrieved May 4, 2018 from https://library.fangraphs.com/misc/li/
Tango, T, (2018). Crucial Situations. Retrieved May 4, 2018 from http://www.insidethebook.com/li.shtml
About the Author
 Rory Houston is a Junior at Saint Joseph's University double majoring in Business Intelligence and Analytics & Sports Marketing, looking to pursue a career in baseball.