Every year 34 players get to take part in what can only be described as one of the most amazing events in all of sports: the MLB All-Star game. These 34 men join an elite club as being the best in the world at their craft, and deserve all the praise that comes along with that title. However, every year after the rosters are announced, headlines always seem to be filled with opinionated pieces about who should and shouldn’t have been picked. So, I decided to dive into the numbers and figure out how a hitter can build a resume worthy of All-Star. I focused on the offensive side of the game because, as the saying goes, “offense sells tickets while defense wins championships.” The same is true when it comes to the MLB All-Star Game selection.
Linear Regression Analysis
To see what truly builds the proper resume for an MLB All-Star, I developed a multi-variable linear regression model based on this year’s All-Star selections to show what statistics a player should focus on. In my analysis, I used all 160 batters that qualify to be on the league leader board, which are batters that have 3.1 plate appearances per game. In doing so, this allows me to cut out any batter with inflated statistics due to a small number of at-bats. I set my All-Star as the dependent variable and made it binary (1 if a player is an All-Star, 0 if a player isn’t) while using a variety of other statistics as my independent variables: runs, hits, doubles, triples, homeruns, RBIs, walks, team winning percentage, strikeouts, stolen bases, batting average (AVG), on-base percentage (OBS), slugging percentage (SLG), and on-base plus slugging (OPS). The full results, as shown below, were pretty shocking.
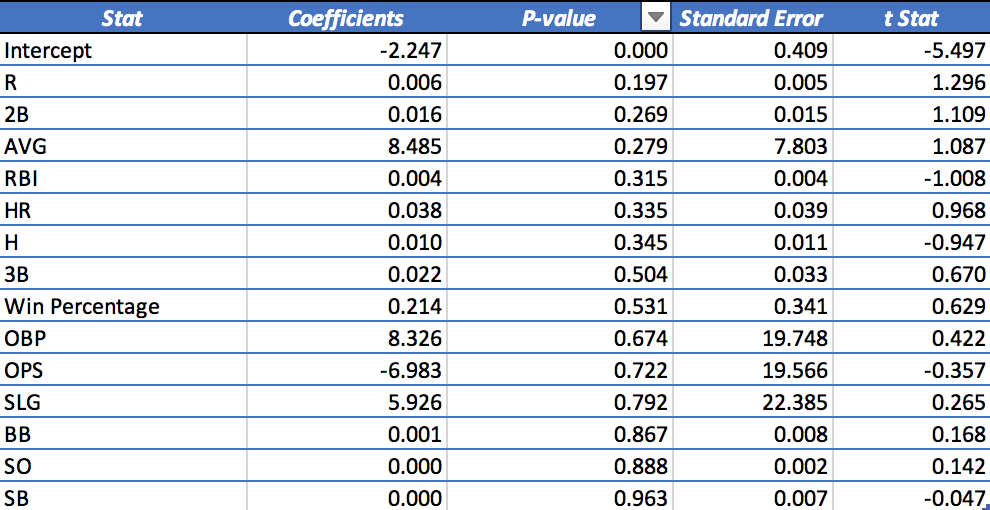
Before going into the variables, it is important to state the results (not shown) of the analysis as a whole. Despite the number of variables used in this regression, the multiple R-value still held strong at .68. An R-value shows correlation between the dependent and independent variables in a regression, so a .68 clearly states that there is moderately strong correlation among all these variables and that the model holds its own. However, a smaller adjusted R-squared value of .41 leaves something to be desired, as the model explains only 41% of the variation in the data. Yet, an extremely small F-value proves that there is significance behind the model created, so now we have to decipher the variables to find where this significance lies.
Looking more in-depth into the results of the respective variables, it is important to see which variables have the lowest p-values to test significance. In this case, the most significant variables in deciding an All-Star, in order are:
- Runs
- Doubles
- Batting average
- RBIs
- Homeruns
- Hits
Even though the p-values reached a little too high for comfort, we can say within 65% confidence that these are the statistics that create the resume for an All-Star hitter.
All-Star Snub Method
Using this knowledge, I decided to take my analysis one step further and find out who was actually the most deserving of an All-Star appearance this year. Having found the variables that create the proper All-Star, I needed to find a way to put these six variables on the same scale and compare them. To accomplish this, I created a z-score for each of the 160 players in each respective category. A z-score is a way of comparing a player’s performance in a statistical category against the average. The higher a player’s z score, the greater they stood out in that statistical area.
Another advantage of making multiple z-scores is it allowed me to compare players across different categories. For example, at a glance you can’t tell if 60 RBIs or 30 homeruns is more impressive, but if the z-score for RBIs is 1.3 while the z-score for homeruns is 2.7 it shows that the 30 homeruns are far more impressive. After calculating each z-score for each category, I was able to average all the z-scores together, for each player, to get one final value to compare against each other. This method proved very effective, with 25 of the top 29 z-score based players being named to the All-Star team. Nevertheless, there were a few players that played exceptionally well this season but didn’t see an All-Star invitation come their way.
Top 3 All-Star Snubs
- Rafael Devers

Despite being on an absolute tear in almost every major statistical category, the third baseman out of Boston was passed up on for Alex Bregman, the third base starter for the American League, and Matt Chapman, the third base backup for the American League. To make this very clear, according to the numbers, Rafael Devers was an All-Star this year and IT WASN’T EVEN CLOSE. Don’t believe me? Let’s take a look at the numbers in the six categories we found were significant.
The reason why I didn’t include the players he was passed up for was because, statistically, Devers was the number one third baseman when it came to average z-score in these categories. His astonishing numbers on the field are shown by his incredible 2.137 z-score for hits, 1.991 z-score for runs, 1.749 z-score for doubles, and 1.465 z-score for RBIs, and 1.861 z-score for batting average. His average was nearly two standard deviations above all the other possible batters in the league. This is absolutely absurd numbers, and is why there is no reason that Rafael Devers shouldn’t be an All-Star this year.
- Eduardo Escobar
Ironically, we return to the exact same position in the exact same league for our second player. Eduardo Escobar has had a phenomenal year for Arizona, but was somehow passed up on for, again, Matt Chapman and Alex Bregman. What do the numbers say?

Even though he was slightly outmatched in doubles, runs, and homeruns (despite still being above the average) Escobar completely outperformed Bregman and Chapman when it came to hits, RBIs, and batting average. In each of these three categories, Escobar performed over a full deviation better than both players, allowing him to end up with an average z-score well-above them. In the end, there is no explanation how Escobar wasn’t invited to the All-Star game, as his performance in the six categories that matter the most were substantially better than the players picked over him.
- Ozzie Albies
Now look, by no means am I advocating for Albies to be a starter. The Atlanta second baseman has had a heck of a first half of the year, but he has not outperformed Katel Marte, the second baseman All-Star starter for the national league. However, the decision to put Jeff McNeil in as the reserve second baseman goes against the data.

While McNeil has performed exceptionally in batting average, hits, and doubles, his lack of consistency is evident as he falls all the way below the average for the other three categories. On the other hand, Albies has managed a stellar performance across almost areas. His ability to be consistently above the league average (only in the homerun statistic does he barely fall below) allows him to standout compared to McNeil. This creates not only an argument for Albies to pass McNeil solely on consistency, but also a higher average z-score which should have led to an All-Star selection.
Conclusion
In conclusion, to all the MLB players hoping to gain an All-Star selection, it is pretty simple: get a lot of hits, and score a lot of runs. While the voting is ultimately out of your control, by following this pattern you position yourself to outperform the competition in the only statistical categories that matter: runs, doubles, batting average, RBIs, homeruns, and hits. Finally, to the players who will be taking the field tonight, congratulations on your selection, deserved or not, and I look forward to a fantastic matchup.
Sources
- https://www.baseball-reference.com
- http://mlb.mlb.com/stats/sortable.jsp#elem=%5Bobject+Object%5D&tab_level=child&click_text=Sortable+Player+hitting&game_type='R'&season=2019&season_type=ANY&league_code='MLB'§ionType=sp&statType=hitting&page=1&ts=1562643959532
- https://www.wksu.org/post/cleveland-preps-mlb-all-star-game