The major league baseball season is in full swing, so I decided to look at what areas of the game have statistically been most important to winning this year. I broke the game down into three main categories: batting, pitching, and fielding. Through linear regression analysis, we will be able to see how batting average, earned-run average, and fielding percentage effect win percentage in MLB teams.
Batting
The statistic I chose to represent the “Batting” category is Batting Average. Batting Average is a team’s total amount of hits divided by the total number of at-bats for the season. Below is a graph that compares every MLB team’s Batting Average with their corresponding Winning Percentage for the current season.
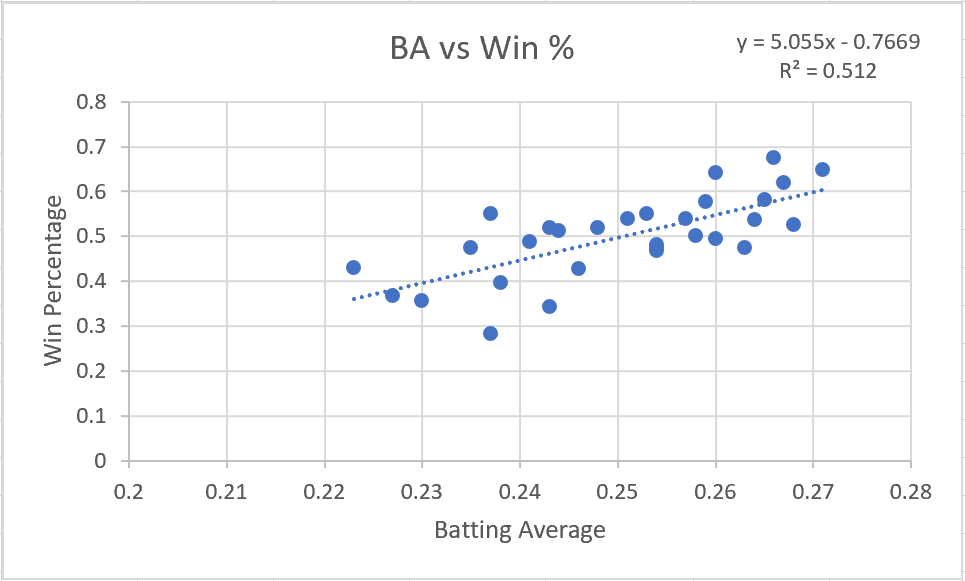
Linear Regression Line: y = 5.055x – 0.7669
Correlation coefficient: r = .716
As we can see from the data above, batting average is an important quality to winning in baseball and has a direct effect on a team’s winning percentage. The correlation coefficient for this statistic is .716. This means that there is a moderate positive correlation between a team’s batting average and its’ winning percentage. In simpler terms, the data says, “the higher a team’s batting average, the higher it’s win percentage.” I then interpreted the linear regression line for some context. The line statistically says, “On average, if a team raises its’ batting average by 1%, its’ winning percentage will go up by 5%.”
Pitching
The statistic I chose to represent the “Pitching” category is Earned Run Average (ERA). ERA is the average number of earned runs allowed per a full 9 inning game. Below is a graph that compares every MLB team’s ERA with their corresponding Winning Percentage for the current season.
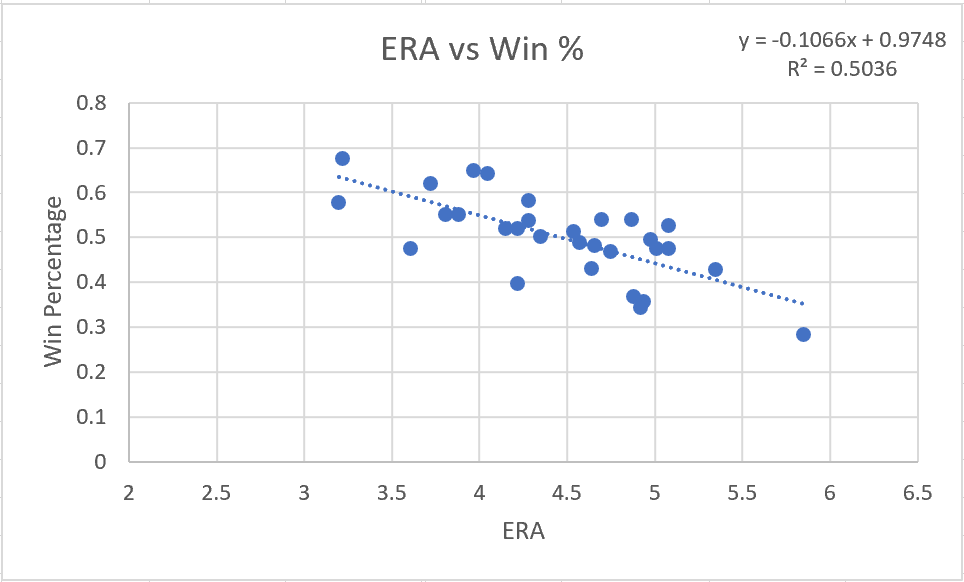
Linear Regression Line: y = -0.1066x + 0.9748
Correlation coefficient: r = -.710
Once again, the data provides evidence that ERA is an important aspect to winning in the major leagues and has a direct effect on a team’s winning percentage. The correlation coefficient between ERA and Winning Percentage is -.710. This means that there is a moderate negative correlation between a team’s ERA and its winning percentage. In simpler terms, the data says, “the lower a team’s ERA, the higher its win percentage.” However, this -.710 correlation is slightly weaker than batting average’s .716 correlation. This means that statistically batting average has a greater effect on winning percentage than ERA does. I then interpreted the linear regression line for some more context. The line statistically says, “On average, if a team lowers its ERA by half a run, its winning percentage will go up by 5.33%.”
Fielding
The statistic I chose to represent the “Fielding” category is Fielding Percentage. Fielding Percentage represents how often a team fields the ball without an error on the play. Below is a graph that compares every MLB team’s Fielding Percentage with their corresponding Winning Percentage for the current season.
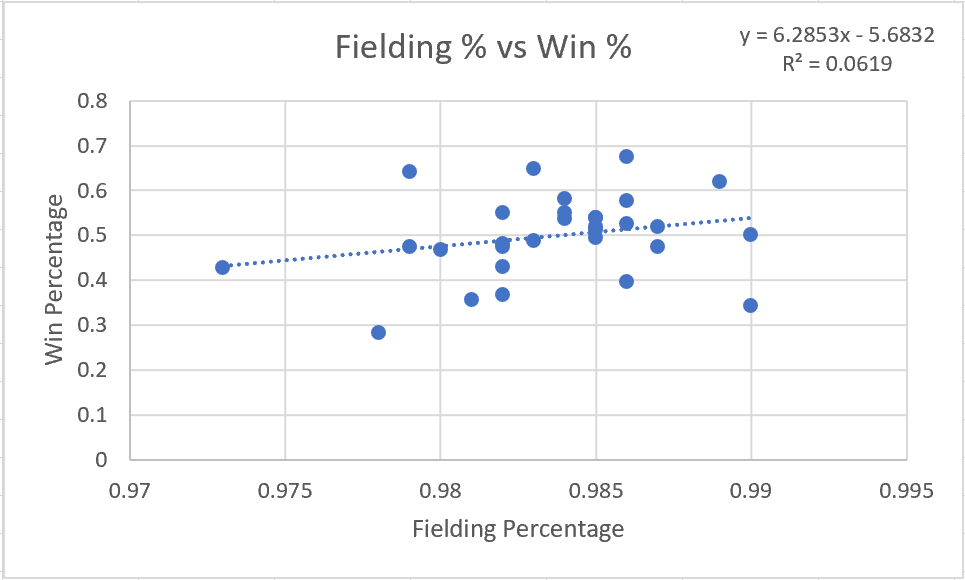
Linear Regression Line: y = 6.2853x – 5.6832
Correlation coefficient: r = .249
Differing from batting average and ERA, fielding percentage does not appear to be as crucial to winning in baseball and has no clear effect on a team’s winning percentage. This is most likely due to there being very little difference between the worst fielding team (97.3%) and the best fielding team (99.0%). The correlation coefficient for this statistic is .249. This means that there is a very weak positive correlation between a team’s fielding percentage and its winning percentage. However, when interpreting the linear regression line for some context, we can still see the effect of a dramatic change in fielding percentage. The line statistically says, “On average, if a team raises its fielding percentage by 1%, its’ winning percentage will go up by 6.29%.”
Conclusion
In conclusion, there is evidence to support the claim that all three of these areas have a positive effect on winning baseball games. However, through linear regression analysis, we can say that batting and pitching are much more important than fielding. We can also conclude that batting is slightly more important to winning games in the MLB this season than pitching.
Sources
mlb.mlb.com
About the Author
Connor just completed his sophomore year at Purdue University, where he is pursuing a double major in actuarial sciences and applied statistics, with a minor in management. He has had a passion for both sports and statistics since a very young age, and enjoys discovering all the new information statistics can give us about sports. Here is a link to his LinkedIn profile: https://www.linkedin.com/in/connor-wolf-bb3775186/.