“Major League Baseball’s turning this game into a joke. They own Rawlings, and you’ve got Manfred up here saying it might be the way they center the pill. They own the [explicit] company. If any other $40 billion company bought out a $400 million company and the product changed dramatically, it’s not a guess as to what happened. We all know what happened. Manfred the first time he came in, what’d he say? He said we want more offense. All of a sudden he comes in, the balls are juiced? It’s not coincidence. We’re not idiots.” This is a quote from Houston Astros pitcher Justin Verlander expressing his concerns about the potential juicing of baseballs used in the major leagues.
The conspiracy of baseball juicing has been around for many years. Essentially, it is the belief that the MLB is deliberately altering their baseballs in order to produce more scoring and excitement in their games. Many players and fans alike have begun to ask questions as to if this juicing is currently occurring in the league. Is there substantial statistical evidence to support these claims? Below I will observe trends in relevant offensive categories from previous years to see if anything hints towards the juicing of baseballs this season.
Home Runs (Last 10 Years)
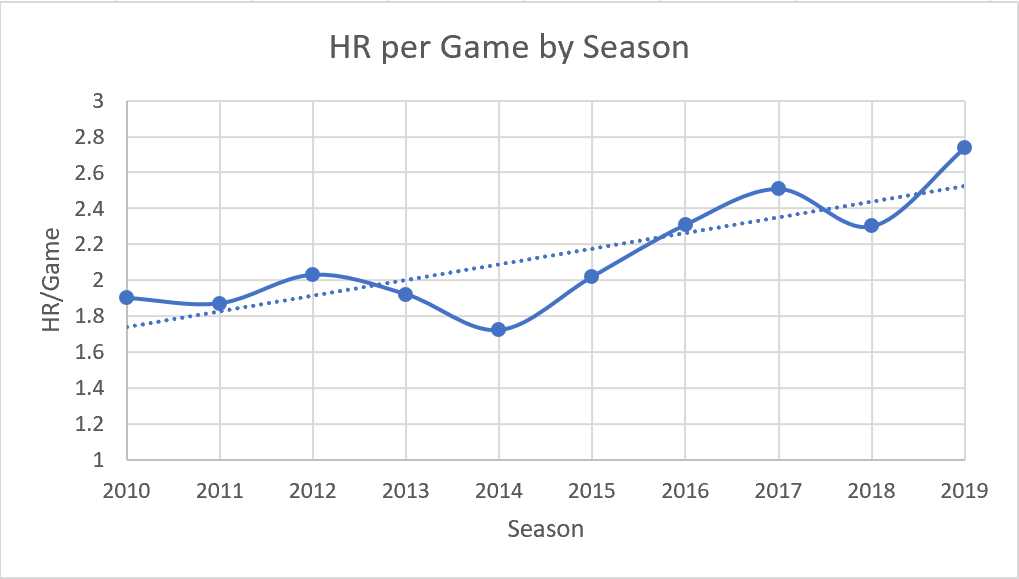
As we can see from the graph above, there seems to be a positive trend in the amount of home runs hit per game throughout the past decade. For context, the average major league game in 2019 (2.74) has more than one whole home run more than the average game in 2014 (1.72), just six seasons ago. The average major league game this season has 2.74 home runs, which is the highest mark of any season this decade.
Runs (Last 10 Years)
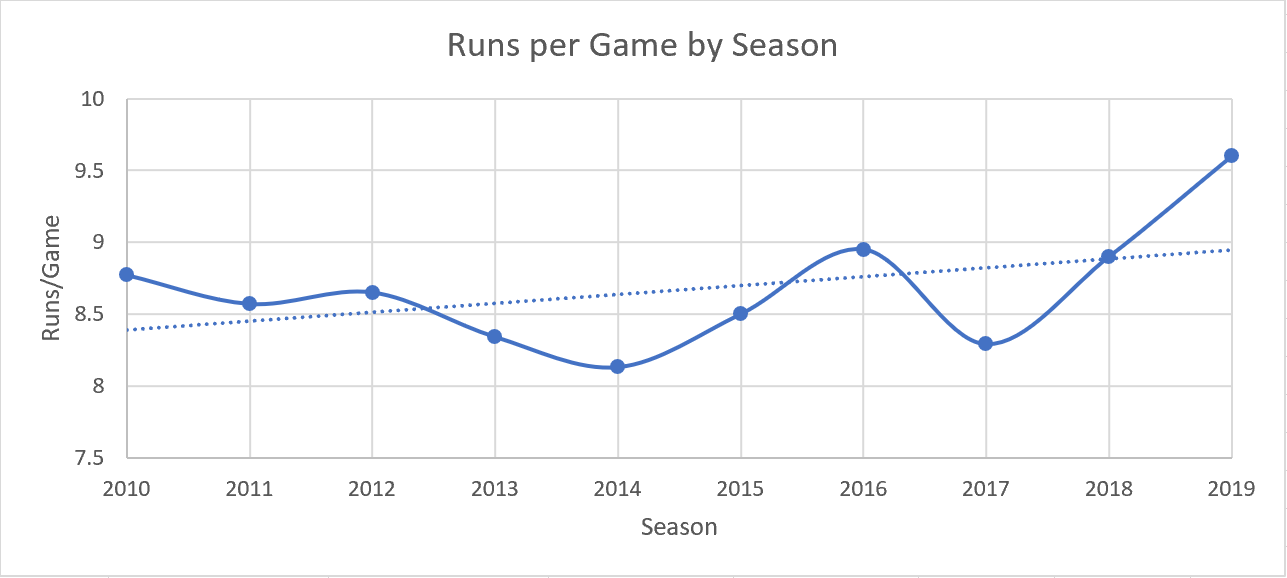
To further show the exciting offense on display this season, I broke down the average amount of runs scored per game over the past decade. As we can see from the graph above, the average number of runs scored per game seems to be trending positively over time. To relate, there is, on average, 1.47 more runs scored in an MLB game in 2019 than there was in 2014. The average major league game this season produces 9.6 runs, which is the highest in the last ten years.
2018 vs 2019: Home Runs
While we can see that offensive statistics have been trending positively for the past decade, this many suspicions about juicing have not occurred until now. The following graphs compare the statistics of all 30 MLB teams from 2018 to 2019 to see the major change in offense from last season to this one.
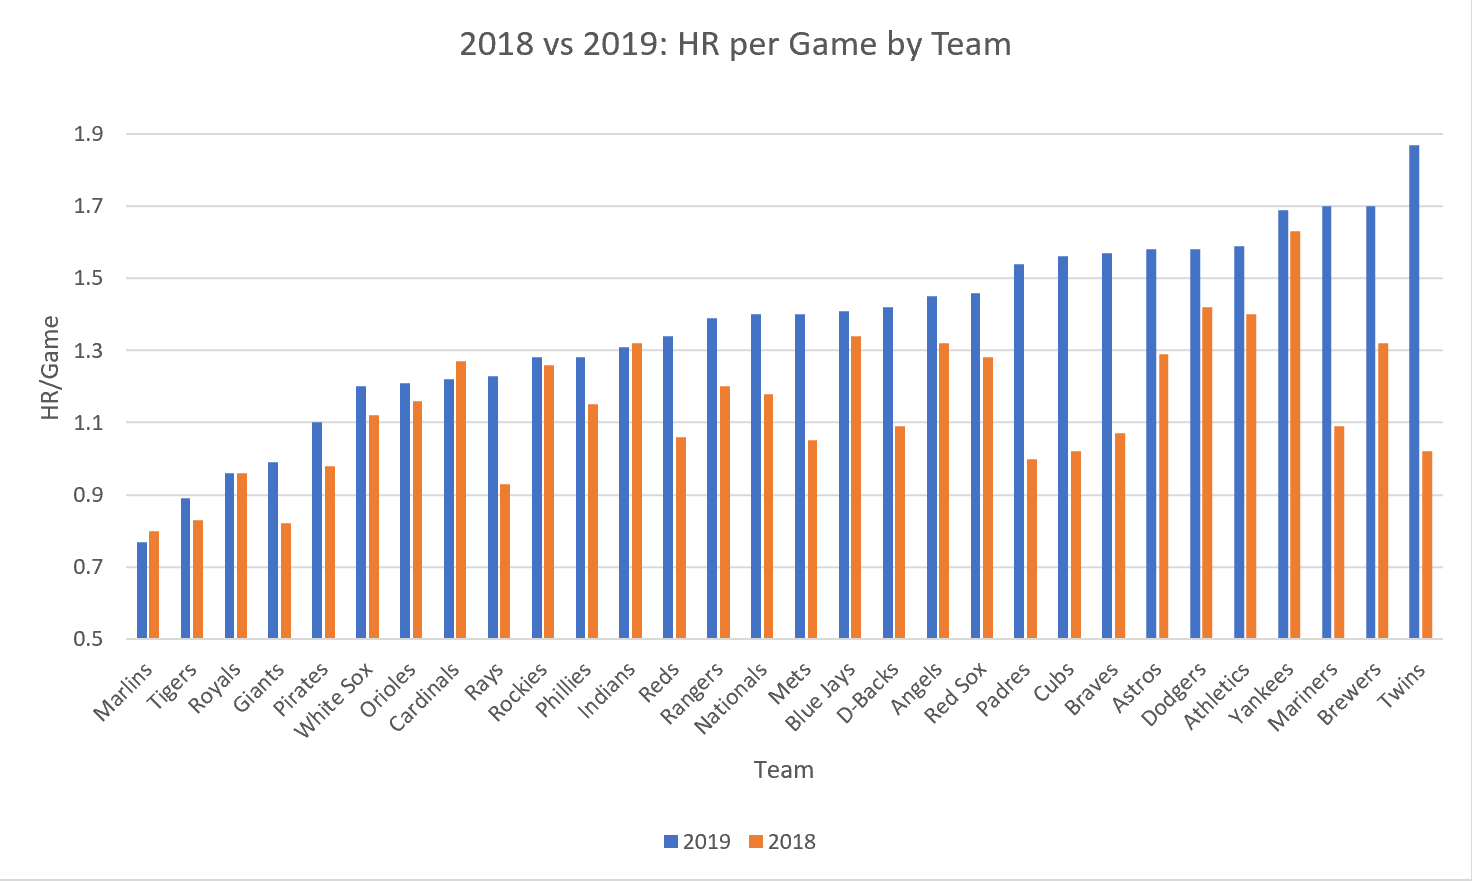
As we can see in the graph above, almost every single team is hitting more home runs per game this season than last season. In fact, there are only three teams in the entire league hitting less home runs this year than last year. This means that 90% of the teams in the MLB are hitting more home runs this season compared to last.
2018 vs 2019: Runs
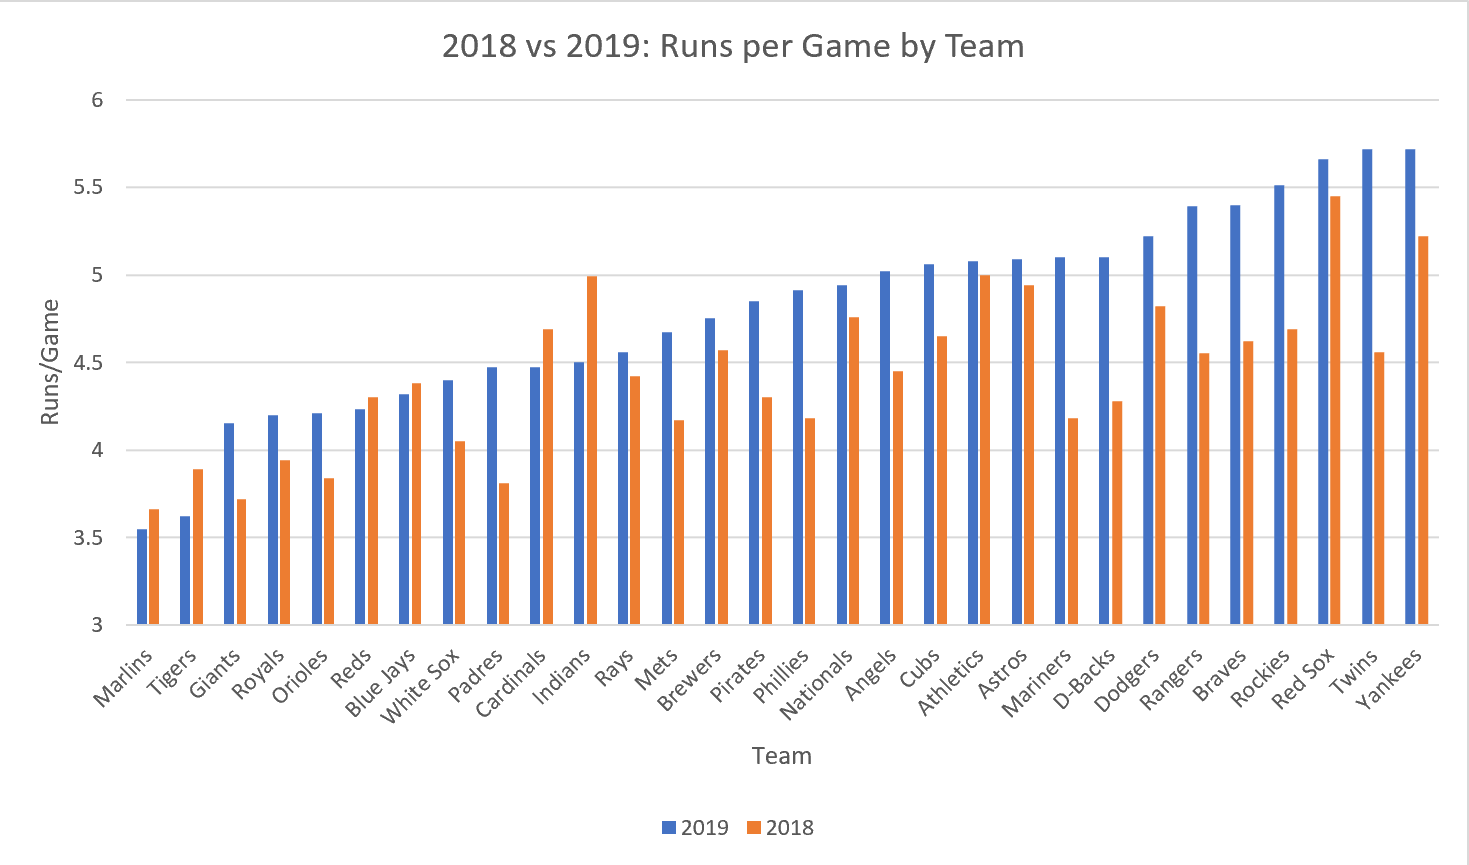
Once again, the graph shows that a heavy majority of the league is scoring more runs this season than they did last season. 24 of the 30 teams in the league are scoring more runs on average this year compared to last year. This means that 80% of the teams in the MLB have increased their scoring since last season. For more context, only three teams in the MLB last season averaged five or more runs per game. Currently, there are 13 teams above that mark.
2018 vs 2019: Slugging Percentage
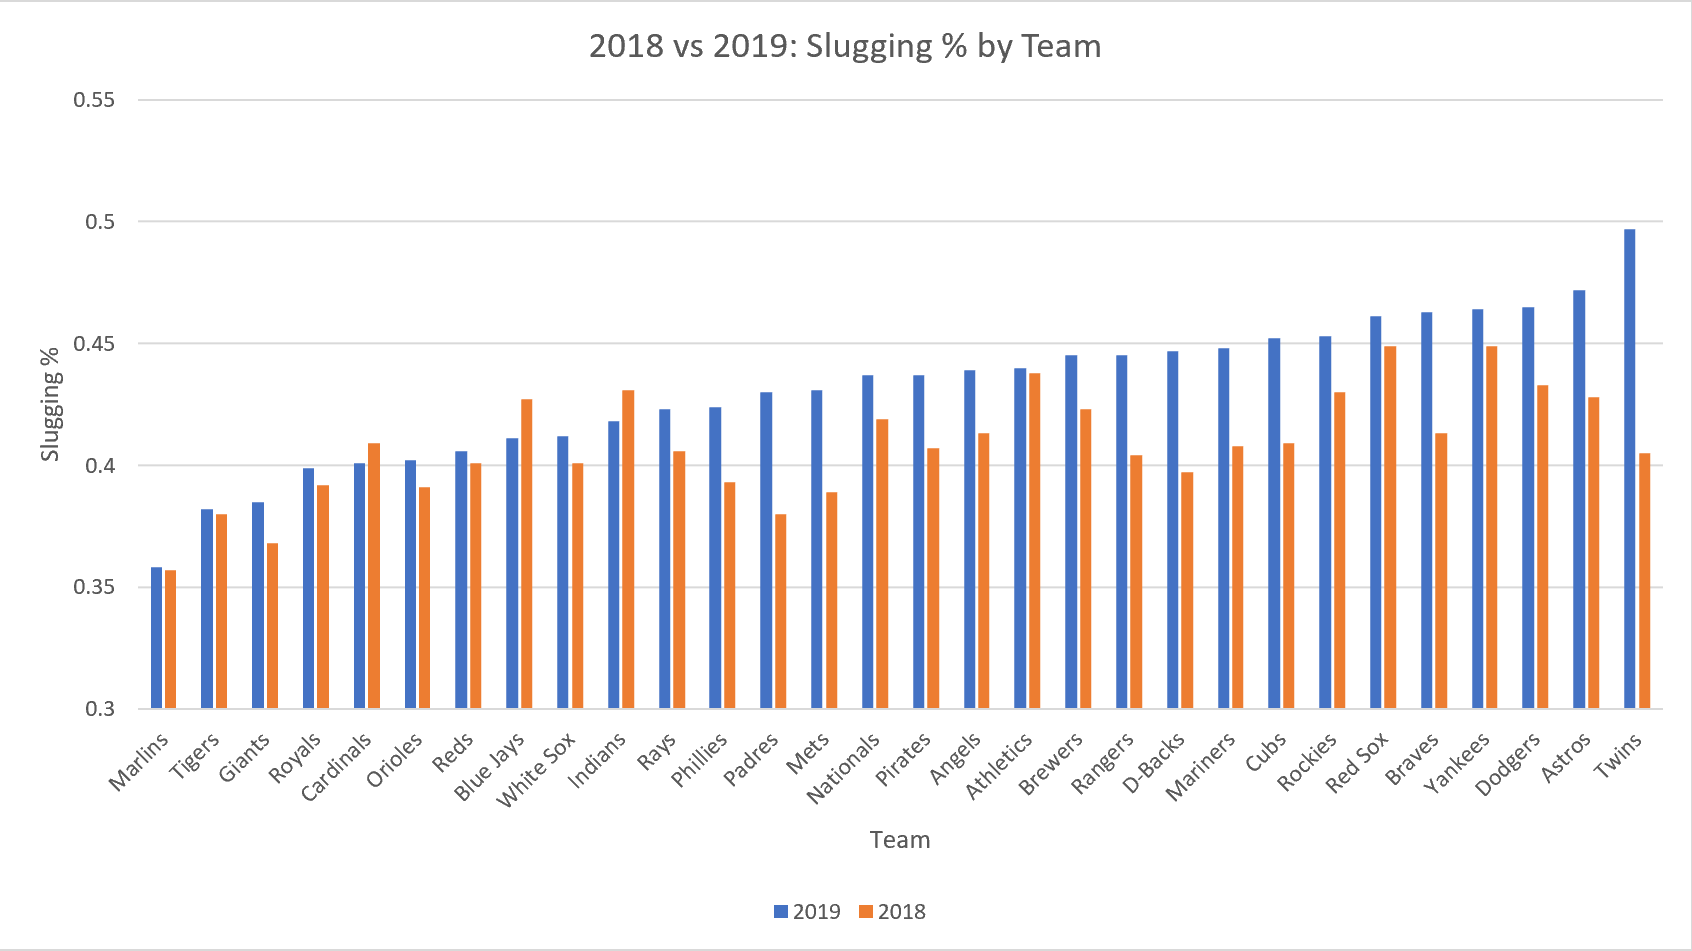
The last offensive statistic I used is slugging percentage. Slugging percentage is found by dividing the number of bases earned by the number of at-bats taken. It is a measure of batting productivity for a team. Sticking with the trend, slugging percentage seems to be up this season compared to last season for almost every major league team. In fact, there are only three teams in the MLB with worse slugging percentages this year compared to last. Therefore, we can say that 90% of the teams in the MLB this season are batting more productively than they did last season.
Conclusion
MLB players and fans have experienced more offense this season than any other in the history of the league. Whether or not this is due to juiced baseballs, I can’t say. However, there is certainly statistical evidence hinting towards it. Lastly, I will leave you with one more stat. The teams in the MLB this season have hit a record-breaking 3,691 home runs before the All-Star break, shattering the old record set in 2017 of 3,343 home runs.
Sources
www.baseball-reference.com
www.teamrankings.com
thebiglead.com
About the Author
Connor just completed his sophomore year at Purdue University, where he is pursuing a double major in actuarial sciences and applied statistics, with a minor in management. He has had a passion for both sports and statistics since a very young age, and enjoys discovering all the new information statistics can give us about sports. Here is a link to his LinkedIn profile: https://www.linkedin.com/in/connor-wolf-bb3775186/.