The NBA said the Defensive Player of the Year (DPOY) award winner will be announced during the Playoffs, so that leaves us some time to debate who should win the prestigious title. This year, there are many players worthy of consideration. Among those is Giannis Antetokounmpo, who led the Milwaukee Bucks to the best record in the NBA. Anthony Davis also deserves consideration, since he anchors the defense of the Los Angeles Lakers, who sit atop the Western Conference. Philadelphia 76ers star Ben Simmons has also been identified as a great defensive presence because of his ability to guard multiple positions. We will compare the three players in different categories to see who should win the award.
Traditional Statistics
The first category where we will compare our candidates is in traditional box score statistics. Figure 1 illustrates the defensive traditional statistics for Anthony Davis, Ben Simmons, and Giannis Antetokounmpo.
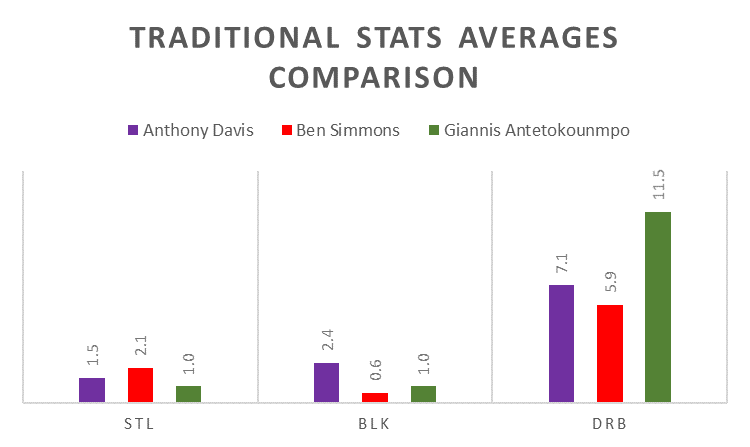
As seen in Figure 1, Anthony Davis is the best blocker out of the three. He is also second in steals and second in defensive rebounds. Ben Simmons, who frequently guards perimeter players, averages 2.1 steals per game, but just 0.6 blocks and 5.9 defensive rebounds. Although Antetokounmpo averages only 1 steal and 1 block per game, he holds a 4.4 defensive rebounds per game advantage over Anthony Davis.
Advanced Statistics
Next, we will compare advanced statistics. These are useful since they take into account the number of minutes played and the total amount of opportunities to record a statistic. For example, Steal Percentage takes into account the number of possessions the opponent had, since you have the opportunity to record a steal every time the opponent has possession of the ball. Block Percentage considers the number of two-point field goals attempted by the opponent (since three-point field goals are rarely blocked). Defensive Rebound Percentage considers every time an opponent misses a shot as an opportunity the player has to record a defensive rebound. Figure 2 illustrates these numbers for our three DPOY candidates.
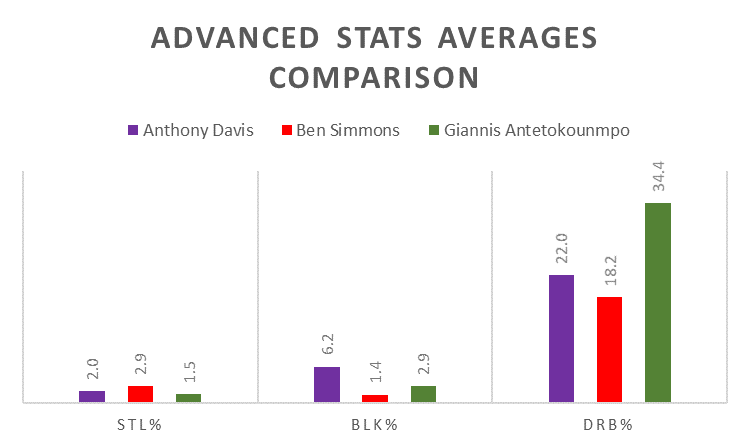
In Figure 2, we can see Anthony Davis steals approximately 2.0% of the opponent’s possessions and blocks around 6.2% of the opponent’s two-point field goals. This highlights how active Davis is on defense. At 2.9%, Ben Simmons’ Steal Percentage is almost 1% higher than Davis’, but Simmons is nowhere near as good of a blocker as Davis. The impressive thing about the Defensive Rebound Percentage comparison is understanding how good of a rebounder Giannis is. He got over a third of all possible defensive rebounds, and this could make up for his deficit in Steal Percentage and Block Percentage.
Hustle Statistics
Although not frequently referenced, Hustle statistics can add another dimension to debates about defense. Figure 3 compares the Deflections per game and Box Outs per game averages from Anthony Davis, Ben Simmons, and Giannis Antetokounmpo.
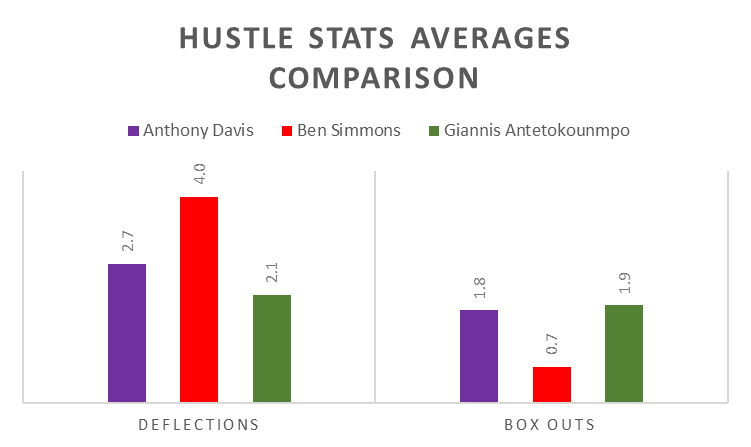
Although important to consider, Figure 3 does not actually bring anything new to the debate. Ben Simmons deflects the most per game, with Anthony Davis in second place and Giannis Antetokounmpo in third place. This is the same order exhibited in the closely related Steals per game comparison. Box Outs per game is also related to a defensive traditional statistic: Defensive Rebounds per game. Giannis Antetokounmpo has the best Box Out average, with Anthony Davis closely behind and Ben Simmons with the lowest average.
Opponent Field Goal Percentage
Last year, FiveThirtyEight’s Nate Silver presented a database with a new statistic: DRAYMOND. This number used Opponent Field Goal Percentage, instead of Blocks or Steals, as a measurement of defensive ability. Although this year’s DRAYMOND numbers are not available, we should take their advice and consider Opponent Field Goal Percentage. Figure 4 does exactly that.
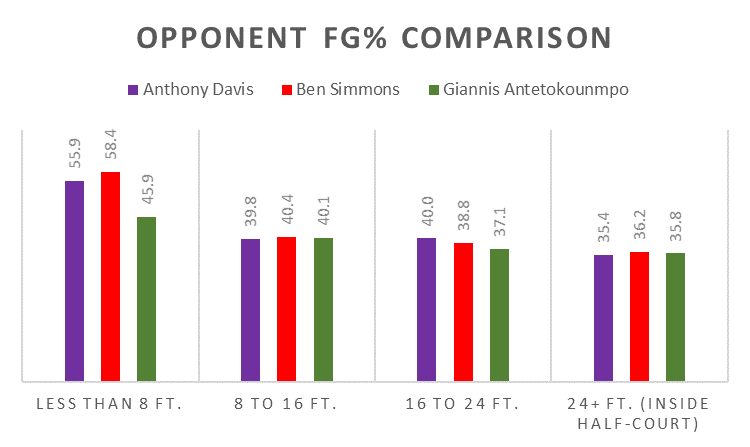
Figure 4 makes Giannis Antetokounmpo look great. His opponents shot 10% worse than Davis’ at less than 8 feet from the rim, who is second in said category. They also shot almost 2% worse than Simmons’ opponents at 16 to 24 feet from the rim, while shooting about the same Field Goal Percentage as Davis’ in the 8 to 16 feet and more than 24 feet category (inside half-court). This means Giannis’ Opponent Field Goal Percentage is either very similar to Davis’ or lower in every category. Ben Simmons is a step behind the two, with opponents shooting the best in every category except between 16 to 24 feet.
Defensive Win Shares
The Defensive Win Shares for our three candidates are illustrated in Figure 5. For every 1 Defensive Win Share, the player’s defense won his team 1 game.
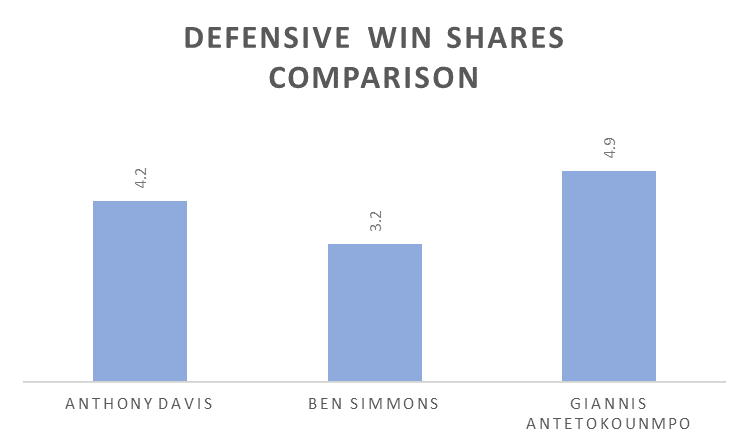
Figure 5 shows that Giannis Antetokounmpo has the highest Defensive Win Shares, with almost 5 Win Shares. Anthony Davis is just 0.7 Win Shares behind, with 4.2 Defensive Win Shares. Ben Simmons is third, with 3.2 Defensive Win Shares.
Team Defensive Rating
Our last section will feature the Los Angeles Lakers, Philadelphia 76ers and Milwaukee Bucks. Figure 6 shows the Defensive Rating for the three teams. This could help us as we try to determine who is the best leader on defense.
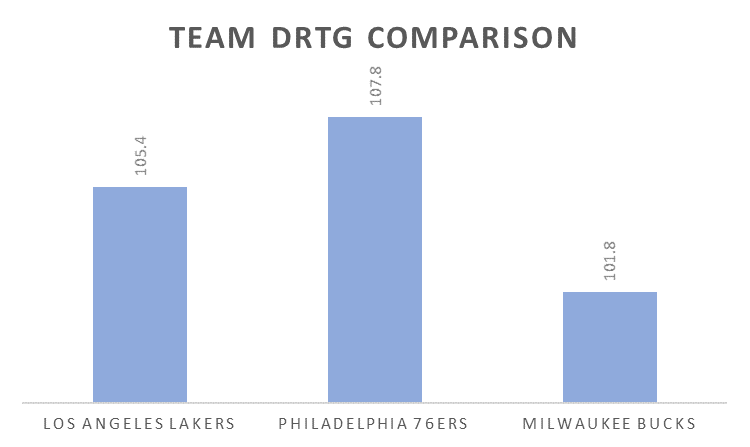
Figure 6 presents the Philadelphia 76ers as the team with the worst defense out of the three, with a Defensive Rating of 107.8 (this means the Philadelphia defense allows 107.8 points per 100 possessions). The Los Angeles Lakers are a little better, at a Defensive Rating of 105.4. The Milwaukee Bucks, at 101.8, comfortably own the best Defensive Rating.
Conclusion
My pick for DPOY is Giannis Antetokounmpo. His opponents shoot worst against him than against Davis or Simmons, and he has the highest Defensive Win Shares. Additionally, the Bucks have the best Defensive Rating out of the three teams. However, this may not be entirely because of Antetokounmpo. Teammate Brook Lopez is also viewed as a DPOY candidate by some. The idea that Giannis gets help from Lopez at the defensive end, when added to Anthony Davis’ great Blocks and Steals per game averages, might motivate voters to select Davis as DPOY. Considering Ben Simmons missed some time due to injury, he might not get the award, but he still deserves an All-NBA Defensive team position.
About the Author
Gustavo Garcia-Franceschini will start his Sophomore year as a Statistics and Machine Learning major at Carnegie Mellon University this Fall. He looks forward to graduate studies and sees himself working for the data department on a sports team.
LinkedIn: www.linkedin.com/in/gustavo-garcia-franceschini
References
NBA Official Release. July 2020. “Voting begins for 2019-20 NBA Awards.” NBA.com. Retrieved from: https://www.nba.com/article/2020/07/21/2019-20-nba-awards-voting
Rafferty, Scott. July 2020. “Who are the leading candidates for Defensive Player of the Year?” NBA.com. Retrieved from: https://ca.nba.com/news/who-are-the-leading-candidates-for-defensive-player-of-the-year/2nc7mmv7ucho10j1b9n6dyyad
Fromal, Adam. January 2012. “Understanding the NBA: Explaining Advanced Defensive Stats and Metrics.” Bleacher Report. Retrieved from: https://bleacherreport.com/articles/1040309
Basketball Reference. “Player Comparison Finder: Anthony Davis (2019-20) vs. Ben Simmons (2019-20) vs. Giannis Antetokounmpo (2019-20).” Retrieved on August 3, 2020 from: http://bkref.com/tiny/4sfxP
NBA Advanced Stats. “Players Hustle.” Retrieved on August 3, 2020 from: https://go.nba.com/xh0wq
Silver, Nate. July 2019. “A Better Way to Evaluate NBA Defense.” FiveThirtyEight. Retrieved from: https://fivethirtyeight.com/features/a-better-way-to-evaluate-nba-defense/
NBA Advanced Stats. “Players Opponent Shooting.” Retrieved on August 3, 2020 from: https://go.nba.com/wx0q9
NBA Advanced Stats. “Teams General Advanced.” Retrieved on August 3, 2020 from: https://go.nba.com/hmjoc
NOTE: Article written before official finalists were announced.