In my upcoming article, Devising Better Training Routines for Outfielders, we explore how players could use outfielder jump data to devise better workouts and improve in games. However, players aren’t the only ones who could find the statistics valuable, as front offices could potentially use them in their player evaluation processes. The outfielder jump data could be employed to unearth hidden talent in undervalued players, predict regression for overperforming athletes, and simply aid teams in making better decisions in their roster construction operations.
As a refresher, outfielder jump statistics attempt to quantify how well outfielders track down fly balls. On Baseball Savant, it is measured by adding up feet saved against league average in 3 stages: reaction, the first 1.5 seconds after contact, burst, the next 1.5 seconds, and route efficiency over the first 3 seconds. It is only calculated on plays rated two stars or more, or plays with catch probability less than 90%. For more details, visit the website.
Some of the core discoveries of Devising Better Training Routines for Outfielders were the skill like behavior of all three phases of outfielder jump, as well as the overwhelmingly high correlations between burst and OAA, which we used to measure overall outfielder performance. Those same notions will inform the steps we take in this article, on our path to create a new stat that front offices would find useful.
Since burst and OAA are so highly correlated, instances where players bursts and OAAs don’t match up are very surprising. However, there are some occurances where players overperform their low burst, and others where they underperform their high burst. In either case, we’d expect to see the player’s OAA regress towards their burst.
In spotting these outlier cases, teams could exploit a potential market inefficiency. Players whose OAAs have been underachieving based on their bursts could make for cheap targets that provide great return on investment, while the overachievers would be overpaid by less enlightened teams as their unsustainable performance doesn’t hold up.
To determine how much a player was underperforming their OAA based on their burst, I created the discrepancy and average discrepancy metrics. Discrepancy is calculated simply by subtracting the standardized and rate based OAA from standardized burst, and the average is found by averaging a player’s discrepancy over several years. The graphic below features the ten players with the highest average discrepancy over the last two years.
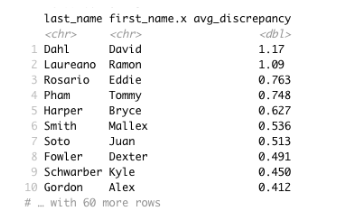
Clearly, Ramon Laureano and David Dahl are in positions to have spectacular fielding performances in the 2020 campaign. One may notice that most of the players in the list above aren’t necessarily what we consider cheap targets, but most of them, like Mallex Smith and Kyle Schwarber, are known for their running or hitting, not their fielding. So, it is possible that their fielding isn’t recognized the same way that their other skills are.
Source
All data updated as of September 14, 2019 and obtained from baseballsavant.mlb.com
About the Author
Jake Federman is a current high school junior at the Horace Mann School in Bronx, NY. He will be interning at the Samford Center for Sports Analytics during this upcoming summer. Outside of sports analytics, Jake plays soccer and tennis, and is on his school’s math team.
Twitter: @jakefederman