Introduction
For the past century, research has been conducted in the area of Professional Sports to quantify wins produced, value, optimized lineups, etc. While this area has seen drastic improvements in the past century due to the forming of big data and machine learning, a new area of sports has entered the scene with large scale implications. In the past 10 years, Esports has entered the picture as a viable sporting career path for gamers. With this new focus on Esports, it is now important that Esports catch up in data-driven models.
While we see that it is substantially easier to model win prediction models and player performance in sports like baseball, as discussed in Sabermetrics, as opposed to complex invasion sports like football, limited research has been done in Esports. With the total prize pool for some games reaching upwards of $100 Million it is becoming more and more important for team owners and coaches to better understand the competition strategies and personnel decision-making optimization pathways.
Esports, specifically LoL, provide a unique way to look at player value since it is hard to quantify them due to the complex invasion nature. We do, however, know that Esports is played as both team sports and individual sports, with some games providing hundreds of in-game character choices. After considering all of this, it is important to mention that some Esports, just as real sports do not have the data available to properly model game and player performance. To best perform these testing models, we will be specifically looking at League of Legends, a MOBA, created by Riot Games in 2009. In choosing this game, we not only chose a familiar game for many people but one that has organized leagues around the world with robust data collection availability.
Background
League of Legends (LOL)
While the “main” games for Esports viewership have changed drastically over the past decade, two constants have remained: League of Legends and Counter-Strike. It is for this reason that we chose to build my modeling around LOL. The game is played in two teams of five champions (in-game players) with the end goal to destroy what is known as the Nexus. This is accomplished by killing both creeps and enemy champions to earn gold. In addition to this, the map or board has a series of neutral monsters that spawn throughout the game that provide the killing teams with increased champion statistics. The teams are divided into five unique roles (lanes) with each one performing a specific task:
- Top: Usually play as Tank/Bruiser champions that provide crowd control for the team in fights, while maintaining a presence in side-lanes throughout
- Jungle: Position between the lanes with the goal to kill neutral monsters and “gank” lanes to allow for teammates to get kills and/or map pressure
- Mid: Basics of each other role, usually provide the Ability Power for the team and are influential in roaming with/without the Jungler to other lanes
- ADC: This role provides most of the team’s attack damage in late game team fights and are required to become heavily itemized to showcase power
- Support: Primary role is to provide safety to the ADC and crowd control and/or healing to the other members of the team
Now that we have divided the game into roles, I will not describe each of the neutral monsters, but they will be important later, as the power they provide can and does heavily skew the outcome of games. Since we are not able to describe each possible outcome of the game due to the infinite number of combinations of potential creep kills, neutral monster kills, and champion kills, in culmination with the fact that you are invading enemy territory, I will, therefore, classify LOL as a complex invasion sport.
Becoming an Esport Pro
While the path to becoming an Esport professional is still rapidly developing, we find it important to discuss the kind of people that are being represented in these models. The standard professional is 20-35 years old in most sports, while in Esports some of the world’s best players are age 16 or under and most career lifespans are over by the time the player is 25 years old (Thompson). This is due to the nature of hand-eye coordination and reaction time. This creates an interesting dynamic since players are currently discovered via in-game ranked leaderboards or an online streaming platform such as Twitch. We have not seen many Esports develop developmental leagues as we have seen in professional sports across the globe. In the past two to three years, many LOL leagues have moved to a franchise, instead of a relegation format as is seen in Europe. This creates an interesting pathway to future research analyzing why leagues are not going for the seemingly more competitive model of promoting and relegating teams.
Data
The data to create to this model and analyze the computing power of it comes from a panel of over 100,000 observations of in-game player statistics of LOL events across the globe from 2016 through 2019 and is summarized in Table 1 (Sevenhuysen). The outcome of interest is the result of the game, a simple 0 or 1 denoting win or loss. In each observation statistics such as kills, deaths, assists, CS, Barons, Elders will be used to determine the percentage of games that result in wins. This dataset is particularly useful because we do not have to view only one league which could suffer from bias in role importance or statistical importance, but we have aggregated the worldwide data into a form where we can analyze it all at once. Another useful aspect of the dataset is the observations of team statistics that will allow us to compute the model with both individual players, roles, or as a whole team to see the varying explanatory power in the models.
Riot Games has transitioned into franchising models across the globe that allow for easier data collection as both teams and the leagues themselves have published data that is easily web scraped as was done in this model. In this dataset, we are also given games from international competitions that place top teams from different regions against each other for worldwide supremacy. I found that looking at games from international competitions was particularly interesting since they seemed to have the greatest level of competitive balance. The nature of the dataset in combination with the nature of LOL leagues means including fixed effects for the region, player, and a patch was not overly complicated and allowed the model to minimize any endogenous factors.
Model
The strategy here is to find a pathway to expected chance to win based on a single position in game performance statistics (Hill). We will have to run a similar regression a total of 5 times to compensate for five roles in the game. The basic identification is:
Where R is the result of the game, the coefficient α measures the effect of the dummy variable that signifies the role of the player. As controls, each model includes a kill, k, that measures the number of kills the player had in-game, the total dragon kills, tdk, and total baron kills by that player's team, tbk. Continuing we have DPM, wpm, and cspm that are the values for damage and wards per minute that the player was earning over the course of the game. The last two controls were for side difference and an interaction term between kills and cs. This interaction term allows us to look at the marginal effect of each since the number of kills and the number of cs is typically highly correlated, especially as an ADC or mid laner. Previous research on a similar model has shown gold difference, dragon difference, and the map side to all be very influential factors of the outcome when looking at the team’s overall win probability model. Lastly, we have another group of fixed effects that could be added to represent the variability in meta over the years and the region in which the game was played. These were influential in the model so that any bias to do with one region’s support of a specific role, or a meta was removed from the model so that we can look at the best probability for each region, or simply a removal of this variable allows for us to look at the whole world at that position if we do not care about meta differences. Due to the creation of the dataset, I am able to employ econometric techniques that allow me to follow a specific player over the course of multiple years both in regional competitions or international competitions and see if certain “splits” allowed for a better model as it refers to a win prediction model.
Results
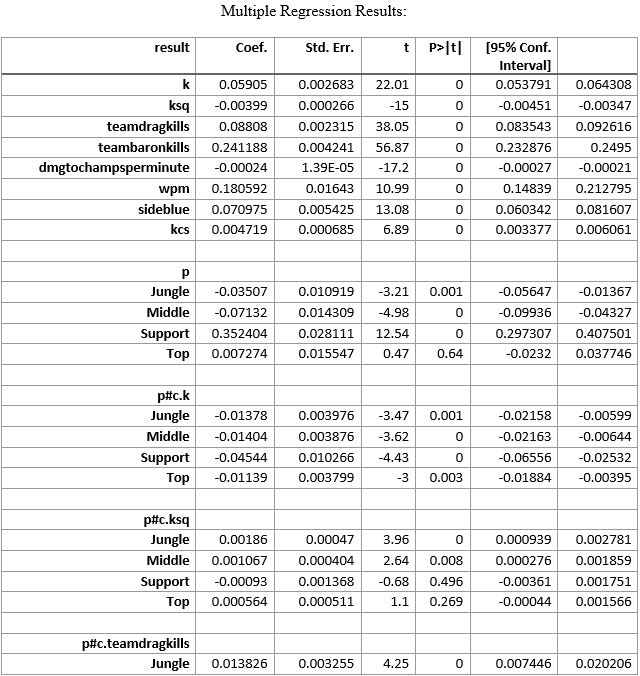
The results from the estimation of equation 1 are reported in the tables section. Due to the nature of LoL and this model, I chose to report the data for each role as we have varying explanatory power and certain variables that explain more of the variation depending on the role. For example, a support player getting a kill has less of a positive impact than an ADC getting a kill, as ADCs are typically responsible as the primary damage dealer in late-game fighting. The results of the regressions lead to an interesting finding, where kills at every roll lead to a worse chance to win except for Top and ADC where additional kills lead to a higher chance to win. Similar explained variation is seen for all five roles on the map, which seems to be a good finding for the confirmation of good data. The results led to a 75% goodness of fit, a value that I believe can be improved upon further interaction and adjusting of the explanatory variables.
To interpret these results, we will use the main regression results which came from the position of ADC. In this regression, all of the regressors that we used were statistically significant but had varying magnitudes of effect on the game’s outcome. For example, each kill led to a 5.9 percentage point increase in win likelihood, but each dragon killed by the team led to an 8-percentage point increase. The results shown here clearly follow the standards that most people would expect in high level LoL play. Baron kills and wards placed per minute are the most drastic shifters in win probability, just as they are in the real game. The power a team receives from baron is very immense, leading to comebacks or ending of games, while placing wards allows for a team to have better vision of the map’s fog of war. The most interesting point in these regression results is the fixed affect for side choice. It has long been stated that the blue side of the map is the most desirable, and we clearly see here that if the team is on blue side, they automatically gain a 7-percentage point chance to win over their opponent. These results validate many claims that casters and coaches make about the important in game statistics, while leaving room for more advanced metrics to better quantify the results in LoL.
Discussion
The popular sentiment in League of Legends communities is that the impact of a single player is drastically important to a team, and while this may be the case in casual games, it does not appear to be the case here. In each of the regressions, the variation in a win or loss is about 75% explained no matter how many significant variables are used in the regression. This value is quite high and allowed for the further analysis of the results.
While the model is not a perfect prediction, which would be extremely rare in modeling, we have multiple ways to head forward from this point in LoL win probability. As explained in Sports Economics (Berri), complex invasion win probability models are incredibly hard to produce, so many ways forward rely on the research and usage of more advanced econometric techniques. In addition to this, a further data mining to grab the time of first drake, second drake, and the team taking them would better allow a model of the first 15 minutes statistics, where the complex invasion part of the game has not created too much disparity. In addition to this, a way to create an additive stat for the bot lane and mid/JG duos may provide for better modeling of those roles, as games seem to have a better win expectation if a team has a duo outperforming the respective enemy duo instead of only looking at solo players.
The paper submitted to the Sports Analytics Conference held annually by MIT in 2018 provides the best commentary on why this model is so complex to correctly describe (Ganguly 8). For starters, it is quite difficult to provide an accurate context that a win probability model describes. This will be especially complex in Esports as many of the current research in Esports suggests that the knowledge barrier that external fans have is one of the hardest to overcome, in traditional sports, people know what stats mean, here that would not be the case at all. The second issue that is shown in win probability research is the uncertainty that the models have, as expected in sports, sometimes underdogs win when all the odds seem against them, these random events cause the data to have large error terms, win probability needs to be able to identify why these outliers happen and better involve them in the regressions. Lastly, data is a major barrier to win probability models, thankfully Riot has an API that is easily accessible, but for some sports, this is not the case. Since other people cannot access data, it is hard to determine if a specific analyst or researcher interpreted the data correctly. We can see here that as data mining and data analytics becomes more important in the 21st century, so will the importance of making the data interpretable and accessible.
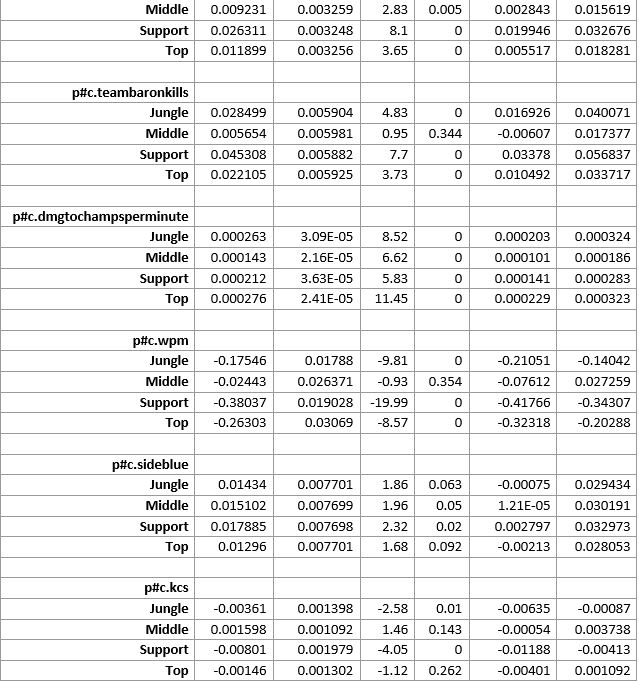
Another way forward, specifically in LoL, is to come up with statistics that take the place of the rudimentary statistics that we are currently using. In baseball WaR, OBS, Slugging and more all represent multiple statistics combined into a new form that allows for better wins produced modeling than the basic statistics do, with LoL these statistics have not yet been formulated and verified, but would allow for interesting future commentary in the space. As shown in the results in figure 3 here, the interaction term importance in this model will be substantial for lowering the F-test value, these interaction terms could become new statistics that provide coaches and analysts in the space better results when looking at team performance.
So far, the only mentioning of the results has been simply that only two roles benefit from getting kills using the regression model in part 4 of the paper. Instead of talking about the regression of each role, I will provide additional commentary on how the ADC regression was run and what the values mean. As we talked about in part 4 of the paper, the model has quite a few dependent variables. In the regression for ADC, the primary part of Table 2, we were able to obtain an r-squared value of 0.75. Holding all else constant the effect of an additional kill is an additional 5.9 percentage point chance to win the game. The most significant factor in the ADC regression is a baron kill, where each baron killed raises the win expectation by 24 percentage points. In the model for ADCs, only the de-meaned k-squared term and the dmg to champ per minute result in a negative win expectation when the value goes up. This all culminated in a model that explained quite a bit of the variation for a complex invasion sport, with the potential for more variation to be explained through dataset manipulation.
While statisticians and sports analysts are becoming increasingly aware of the value of data in Esports, the true value has yet to be quantified and will be an interesting development across the next decade. The results presented here lead us to believe that we are not able to find a capable way to predict wins in LoL, but as we have seen numerous times in other sports additional research may very well unearth better ways to model Esports. I find that the impact of a single player in LoL, even in the “most important” roles does not drastically change the teams' outcome, which means that unobservable factors like in-game leadership and team decision making have a much bigger impact in predicting a teams win chances.
References
Berri, Dave. (2017) Sports Economics. Southern Utah University
Edwards, Griffin. “Creating 'Reasonable Accommodations' for Disabled Individuals. The Golf Cart Test.” SSRN, 10 Nov. 2013, papers.ssrn.com/sol3/papers.cfm?abstract_id=2352008.
Ganguly, S., & Frank, N. (2018). The Problem with Win Probability. MIT Sloan Sports Analytics Conference. http://www.sloansportsconference.com/wp-content/uploads/2018/02/2011.pdf
Hill, Stephen. “Building a Basic, In-Game Win Probability Model for the NFL.” Medium, Medium, 17 Aug. 2019, medium.com/@technocat79/building-a-basic-in-game-win-probability-model-for-the-nfl-54600e57fe1c.
Hodge, et al. “Win Prediction in Esports: Mixed-Rank Match Prediction in Multi-Player Online Battle Arena Games.” ArXiv.org, 17 Nov. 2017, arxiv.org/abs/1711.06498.
Sevenhuysen, Tim. “Oracle's Elixir.” Oracle's Elixir, 2 Apr. 2020, oracleselixir.com/.
Thompson, Joseph J., et al. “Over the Hill at 24: Persistent Age-Related Cognitive-Motor Decline in Reaction Times in an Ecologically Valid Video Game Task Begins in Early Adulthood.” PLOS ONE, Public Library of Science, journals.plos.org/plosone/article?id=10.1371%2Fjournal.pone.0094215.
Tables
Table 1
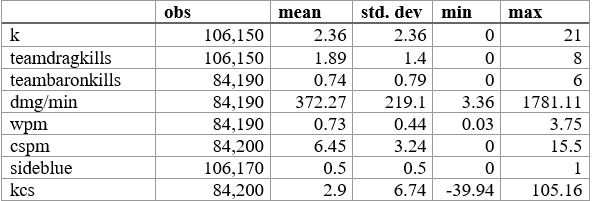
Table 2
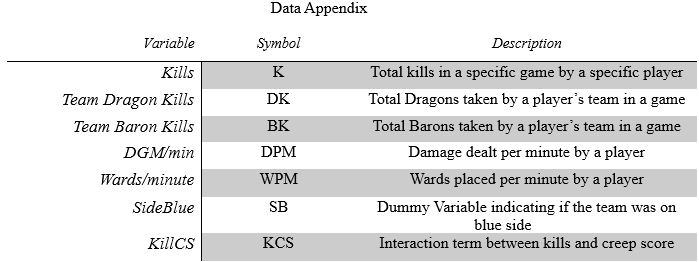
Table 3
Acknowledgment
This paper was produced under the guidance of Dr. Joshua Robinson, Professor of Economics at The University of Alabama at Birmingham. The original purpose of this paper was to satisfy a final paper requirement in Introductory Econometrics. Dr. Robinson helped to verify the data was acceptable and worked with me on setting up STATA to run the regressions. It was Dr. Robinson who also guided me to continue on this topic looking at logit regressions and further ways to model probability in League of Legends, which I hope to write soon.
About the Author
Chandler is a sophomore at the University of Alabama at Birmingham (UAB) where he is majoring in Mathematics on the Mathematics Fast Track Program, with minors in Economics and Computer Science. In addition to his studies and this internship, he currently works with the Information Technology Department at UAB. Because of his strong interest in both sports data and math, Chandler has been drawn to sports analytics since his childhood. After graduation Chandler hopes to work in the MLB, NFL, or Esports to help with in-game strategy and personnel decision making.
Twitter: @ChandlerHubbard