Baseball’s Growing Trend
For as long as sports have been played, coaches have found ways to put their players in the best position to produce individually and holistically. Since the beginning of professional baseball in 1869 with the formation of the Cincinnati Red Stockings, coaches have used a very similar technique for creating their batting order. The leadoff man typically is a fast runner that regularly makes contact with the ball. The second hitter has good bat control and bunting ability to be used in moving the leadoff man around the bases and into better scoring position. The third hitter (typically, and arguably, the best hitter on the team) has the hitting skills to drive in the run and put a point on the scoreboard. The fourth hitter is the biggest power threat. The fifth hitter also has power and a knack for driving in runs. The sixth through ninth positions are filled with the remaining starters, usually in descending order of batting skills.
In recent years, organizations have begun searching for new ways to optimize a lineup. Leaning heavily on science, probabilities, and analytics, team and freelance analysts (known as “sabermetricians,” empirical analysts specifically studying in-game activity in baseball) have sought approaches to use players in more efficient ways. Capitalizing on this trend and leveraging resources and guidance from Samford’s Center for Sports Analytics, I aim to compare several methods promoted as optimal for the batting lineup. As a number of published studies have focused at the professional level, my unique interest is exploring the variance of these lineup structures at the collegiate level.
Lineup Optimization in the SEC
To begin my study, I chose to run various tests on the baseball programs in the Southeastern Conference (SEC). The SEC is a powerful collegiate baseball conference, having produced two of the last five champions (Vanderbilt in 2019, Florida in 2017) and seven of the last twenty (35%). The Pac-12 Conference is the next closest with five champions in the last twenty seasons (25%), with Oregon State’s program claiming three of those crowns (2018, 2007, and 2006). For this pilot study, I collected all published game statistics for the rosters of each of the fourteen SEC baseball teams for the 2019 season, the last full collegiate baseball season.
A Game Changing Technology
Anticipating a need to test alternative lineups, I began looking into simulation technologies. I came across an article posted by Driveline Baseball that highlighted Seqnzr, a new simulation software for baseball and softball lineup optimization. Founded by former pitcher Brian McAfee and his father Frank in March of 2020, Seqnzr is a Python-based simulation modeling tool directed toward helping coaches make data-driven lineup decisions. The tool allows for lineups to be simulated across thousands of games in a matter of moments, giving users the ability to evaluate a team’s overall offensive strategy as well as players’ individual impact on run production. After several conversations with Brian to share the direction and aims of my research, it was evident that Seqnzr was an ideal tool for my analyses.
Testing
Seqnzr’s model begins with a massive distribution of possible outcomes for hitters based on historical data. It analyzes the probability of a specific outcome and simulates a full game, one at-bat at a time. They have determined that running 50,000 games per simulation allows for the margin of error to be minimized and produce the most accurate results.
To test these lineups in Seqnzr, I inputted, each player’s 2019 statistics, created a lineup, and ran the simulation. Upon its completion, I was able to view every player’s projected statistics and a team’s average number of runs scored across the 50,000 simulated games. For example, one lineup might average 5.25 runs per game, but if the batters are rearranged in a more strategic order, the new lineup might produce 5.35 runs per game. This suggests a team would therefore average 0.10 more runs per game with the optimized lineup, producing six extra runs over a (typical) sixty-game college baseball season.
Lineups
To begin my comparison, I attempted to find a coach’s “best” lineup by taking the lineup used in one of the most critical games from each SEC team’s 2019 season (e.g., College World Series game, regional playoff game, or last conference series during the regular season, depending on how far the team advanced) and used the nine players in that lineup to run my simulations. This lineup served as my “baseline” to compare with other simulations, and it helped to account for defensive arrangement. All players that were included in these baseline tests played in nearly thirty-five percent of their team’s games over the course of the 2019 season.
The second lineup I generated was based strictly on the OPS (on-base percentage plus slugging percentage) metric. This measure is a popular sabermetric measurement in evaluating overall hitting skill, combining how well a hitter reaches base with how well they can hit for average and power. To create this lineup, players were arranged in descending order of OPS due to common recognition that each additional position in the batting order reduces the opportunity to reach the plate (see Table 1); therefore, the best hitters get the most plate appearances in any given game and over the course of the season. Several MLB teams, including the first-place Los Angeles Dodgers, have utilized this general method at times during the 2020 MLB season.
Derived from a popular sabermetrics guide simply titled The Book, the third lineup is a more complex form of the OPS-based lineup developed by placing more emphasis on slugging (SLG) and on-base percentage (OBP) as individual characteristics (Tango et al., 2007). The authors place a significant importance on the individual pieces in a lineup, giving each batter his own role, top to bottom.
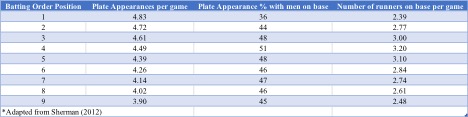
In contrast to an OPS-based lineup, The Book identifies OBP as the most important metric for a leadoff hitter. Through extensive analysis, the authors determined that the second hitter has more crucial plate appearances than anyone else in the lineup. Instead of being a player who can bunt and move runners, the second position should be the team’s best hitter. Unlike most lineups, sabermetricians have identified the third spot in the lineup to be less important than traditionally thought. This hitter should be positioned after more important positions (leadoff, second, fourth, and fifth) are filled, though there are still ample opportunities for run production for this spot in the lineup (hitting with an average of three runners on base per game). The cleanup hitter should be the second-best overall hitter on the team, as this spot has the most potential to drive in runs (see Table 1). The fifth position has the next most opportunities to drive in runs, and so a powerful slugger is preferred here. Positions six through nine parallel the traditional order by arranging players in decreasing offensive ability (Kalkman, 2012). Tango bases this theory off statistical probabilities, some of which are highlighted in Table 1, and argues for the strategic placement of specific skillsets – quantified by traditional statistics – in order to maximize a team’s output.
To be clear, I paralleled Tango’s ideas by building lineups in the following manner. The second hitter was the first position in the batting order to be filled due to the high number of plate appearances and opportunities to hit with runners on base. Thus, I chose the hitter with the highest OPS, designating the best overall hitter on the team. The fourth hitter was selected next by identifying the second highest OPS. I then positioned the leadoff hitter as the player with the highest OBP, not already included in the second or fourth positions. The fifth hitter was slotted by identifying the hitter with the highest SLG (not already included in the 1, 2, and 4 slots). Because the third hitter is not as significant in Tango’s model, this spot was filled fifth by the hitter with the next best SLG among the remaining hitters in the lineup. Positions six through nine are based off the highest OPS and placed in descending order.
SEC Comparisons
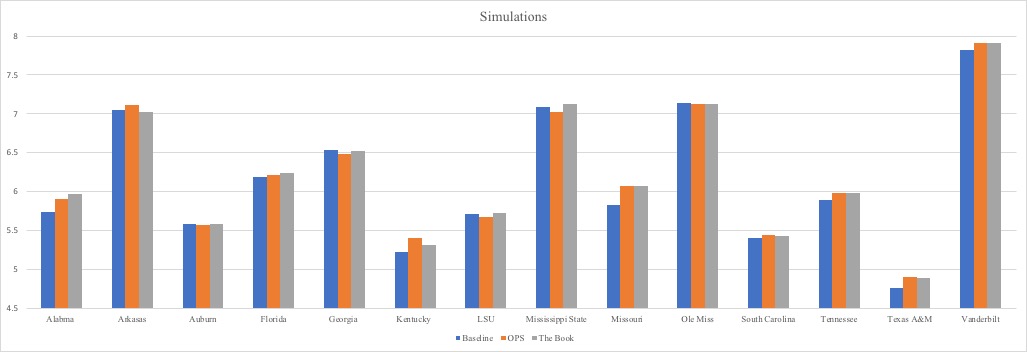
When evaluating these three lineups, I compared the OPS and The Book results to the baseline simulations to see if they would give additional benefit to a team (See Figure 1). Only 14.29% of the teams (Georgia and Ole Miss) had the highest output from their baseline simulation. The OPS-based simulation produced a higher output than the baseline in 64.29% of comparisons. The Book proved to be the most beneficial when compared to the baseline, producing a higher output for 78.57% of teams. Even Vanderbilt, the nation’s best team in 2019, could have improved their run production; The Book projected Vanderbilt to score almost nine more runs over their 71-game season than the one used by Coach Tim Corbin to defeat Michigan in the College World Series finals.
Conclusions
These results add to the growing interest in statistics-driven lineup optimization, and affirm similar MLB analysis for collegiate lineups. It was noteworthy that Alabama and Kentucky, the two teams left out of the 2019 SEC tournament, had some of the largest differentials between the baseline lineups and the optimized lineups, suggesting there was greater opportunity to score runs over the course of the season. Alabama lost five 2019 games by only one run, while Kentucky lost three one-run games. Perhaps their season could have looked different if they scratched out a few more runs with a more optimal batting lineup?
After the conclusion of my pilot study featuring the SEC, the next step of this project is to continue to expand the study across additional conferences to see if the quality of The Book and OPS lineups hold. I would also like to simulate previous years of statistics to add to the robustness of the study. Additionally, I am excited to continue on with the Seqnzr software, as their development team continues to refine its simulator. In July 2020, Seqnzr partnered with 643 Charts, an advanced scouting and analytics source, to increase the precision of their play-by-play data. As the power of this simulation tool continues to grow, and more analytically-minded coaches begin optimizing their lineups, I expect positive trends in run production with restructured lineups across all levels of baseball.
References
Caravan, A., & McAfee, B. (2020, February 25). Seqnzr: Simulation Modeling For Lineup Optimization. Driveline Baseball - Data-Driven Baseball Performance Training.
Kalkman, S. (2012, October 9). Optimizing Your Lineup By The Book. Beyond the Box https://www.beyondtheboxscore.com/2009/3/17/795946/optimizing-your-lineup-by
Sherman, N. (2012, October 12). Optimizing order: Building the ideal lineup. Bluebird Banter. https://www.bluebirdbanter.com/2012/10/12/3490578/lineup-optimization-part-1-of-2
Tango, T. M., Lichtman, M. G., & Dolphin, A. E. (2007). The Book: Playing the Percentages in Baseball. Potomac Books.
About the Author
Will David is a third year student pursuing a finance and marketing double major with a concentration in sports marketing and analytics. He also plays baseball at Samford University.
Twitter: @will_david3