
Introduction
The NBA season resumed late July at Walt Disney World Resort. The players have been practicing and playing there, while being housed nearby. In an earlier article, we saw how this could affect the season after proving that the once valuable home-court advantage will not be a factor in the playoffs. We saw that, on average, the home team scores around 2.6 more points than the away team. Why does this happen?
Hypothesis
To reduce the risk of COVID-19 getting to players and spreading from one team to another, fans are not present at the games. A study done at Harvard University showed that referees, influenced by the crowd size, gave an advantage in penalties allowed at English Premier League soccer games observed. This then resulted in home teams averaging more goals than away teams.
We will test a similar hypothesis in the NBA: An increase in crowd size positively affects the home team, while negatively affecting the away team.
Data
We are using a dataset that contains all NBA regular season games from the past five seasons, up to the 2020 hiatus. Note that NBA Global games are not included in this dataset. The dataset contains the following variables:
- Home team
- Away team
- Points scored by home team
- Points scored by away team
- Total points (Points scored by home team plus points scored by away team)
- Attendance
- Capacity percentage
- Capacity Percentage group (100% or more: Sellout, 99%-95%: High, 94%-86%: Medium, 85% or less: Low)
There is a total of 5,877 observations. The bar plot below illustrates the mean amount of total points scored in a game, divided by the four capacity percentage groups.
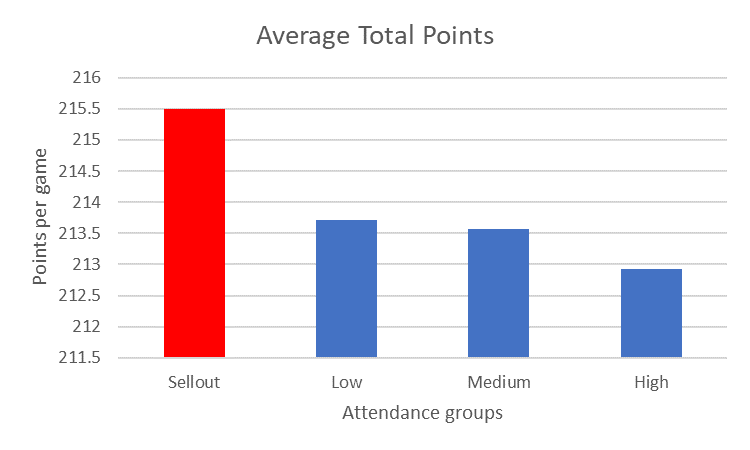
Figure 1: Average total points scored in a game, grouped by attendance group.
We can see that, although the average points per game for the “Low”, “Medium” and “High” attendance groups are very similar, the average points per game for the “Sellout” attendance group is distinguishingly different from the rest.
Results
Preliminary linear models showed correlation between points scored by both the away and home team and attendance. This correlation, as hypothesized, was positive for the home team and negative for the away team. However, the r-squared for these models was very low (0.001112 for the home team subset and 0.003225 for the away team subset). Also, an ANOVA test found correlation between total points scored in a game and attendance (p-value > 0.00253). Table 1 indicates the results of other ANOVA tests done on the database. Table 2 lists results from diagnostic tests done on those models found to be significant.
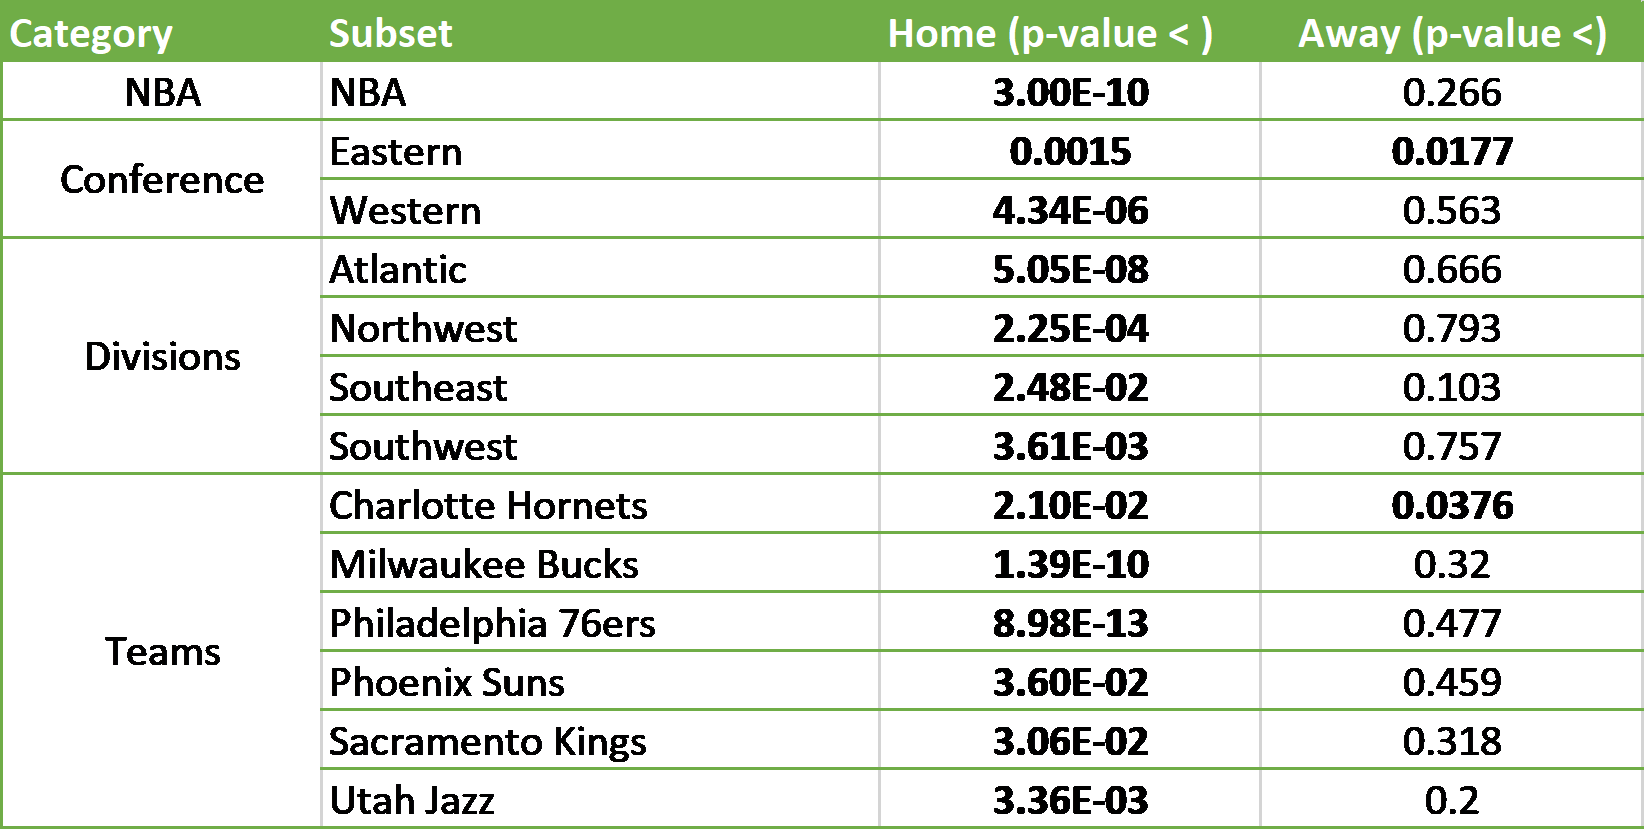
Table 1: P-values from significant results in ANOVA tests done with the database.
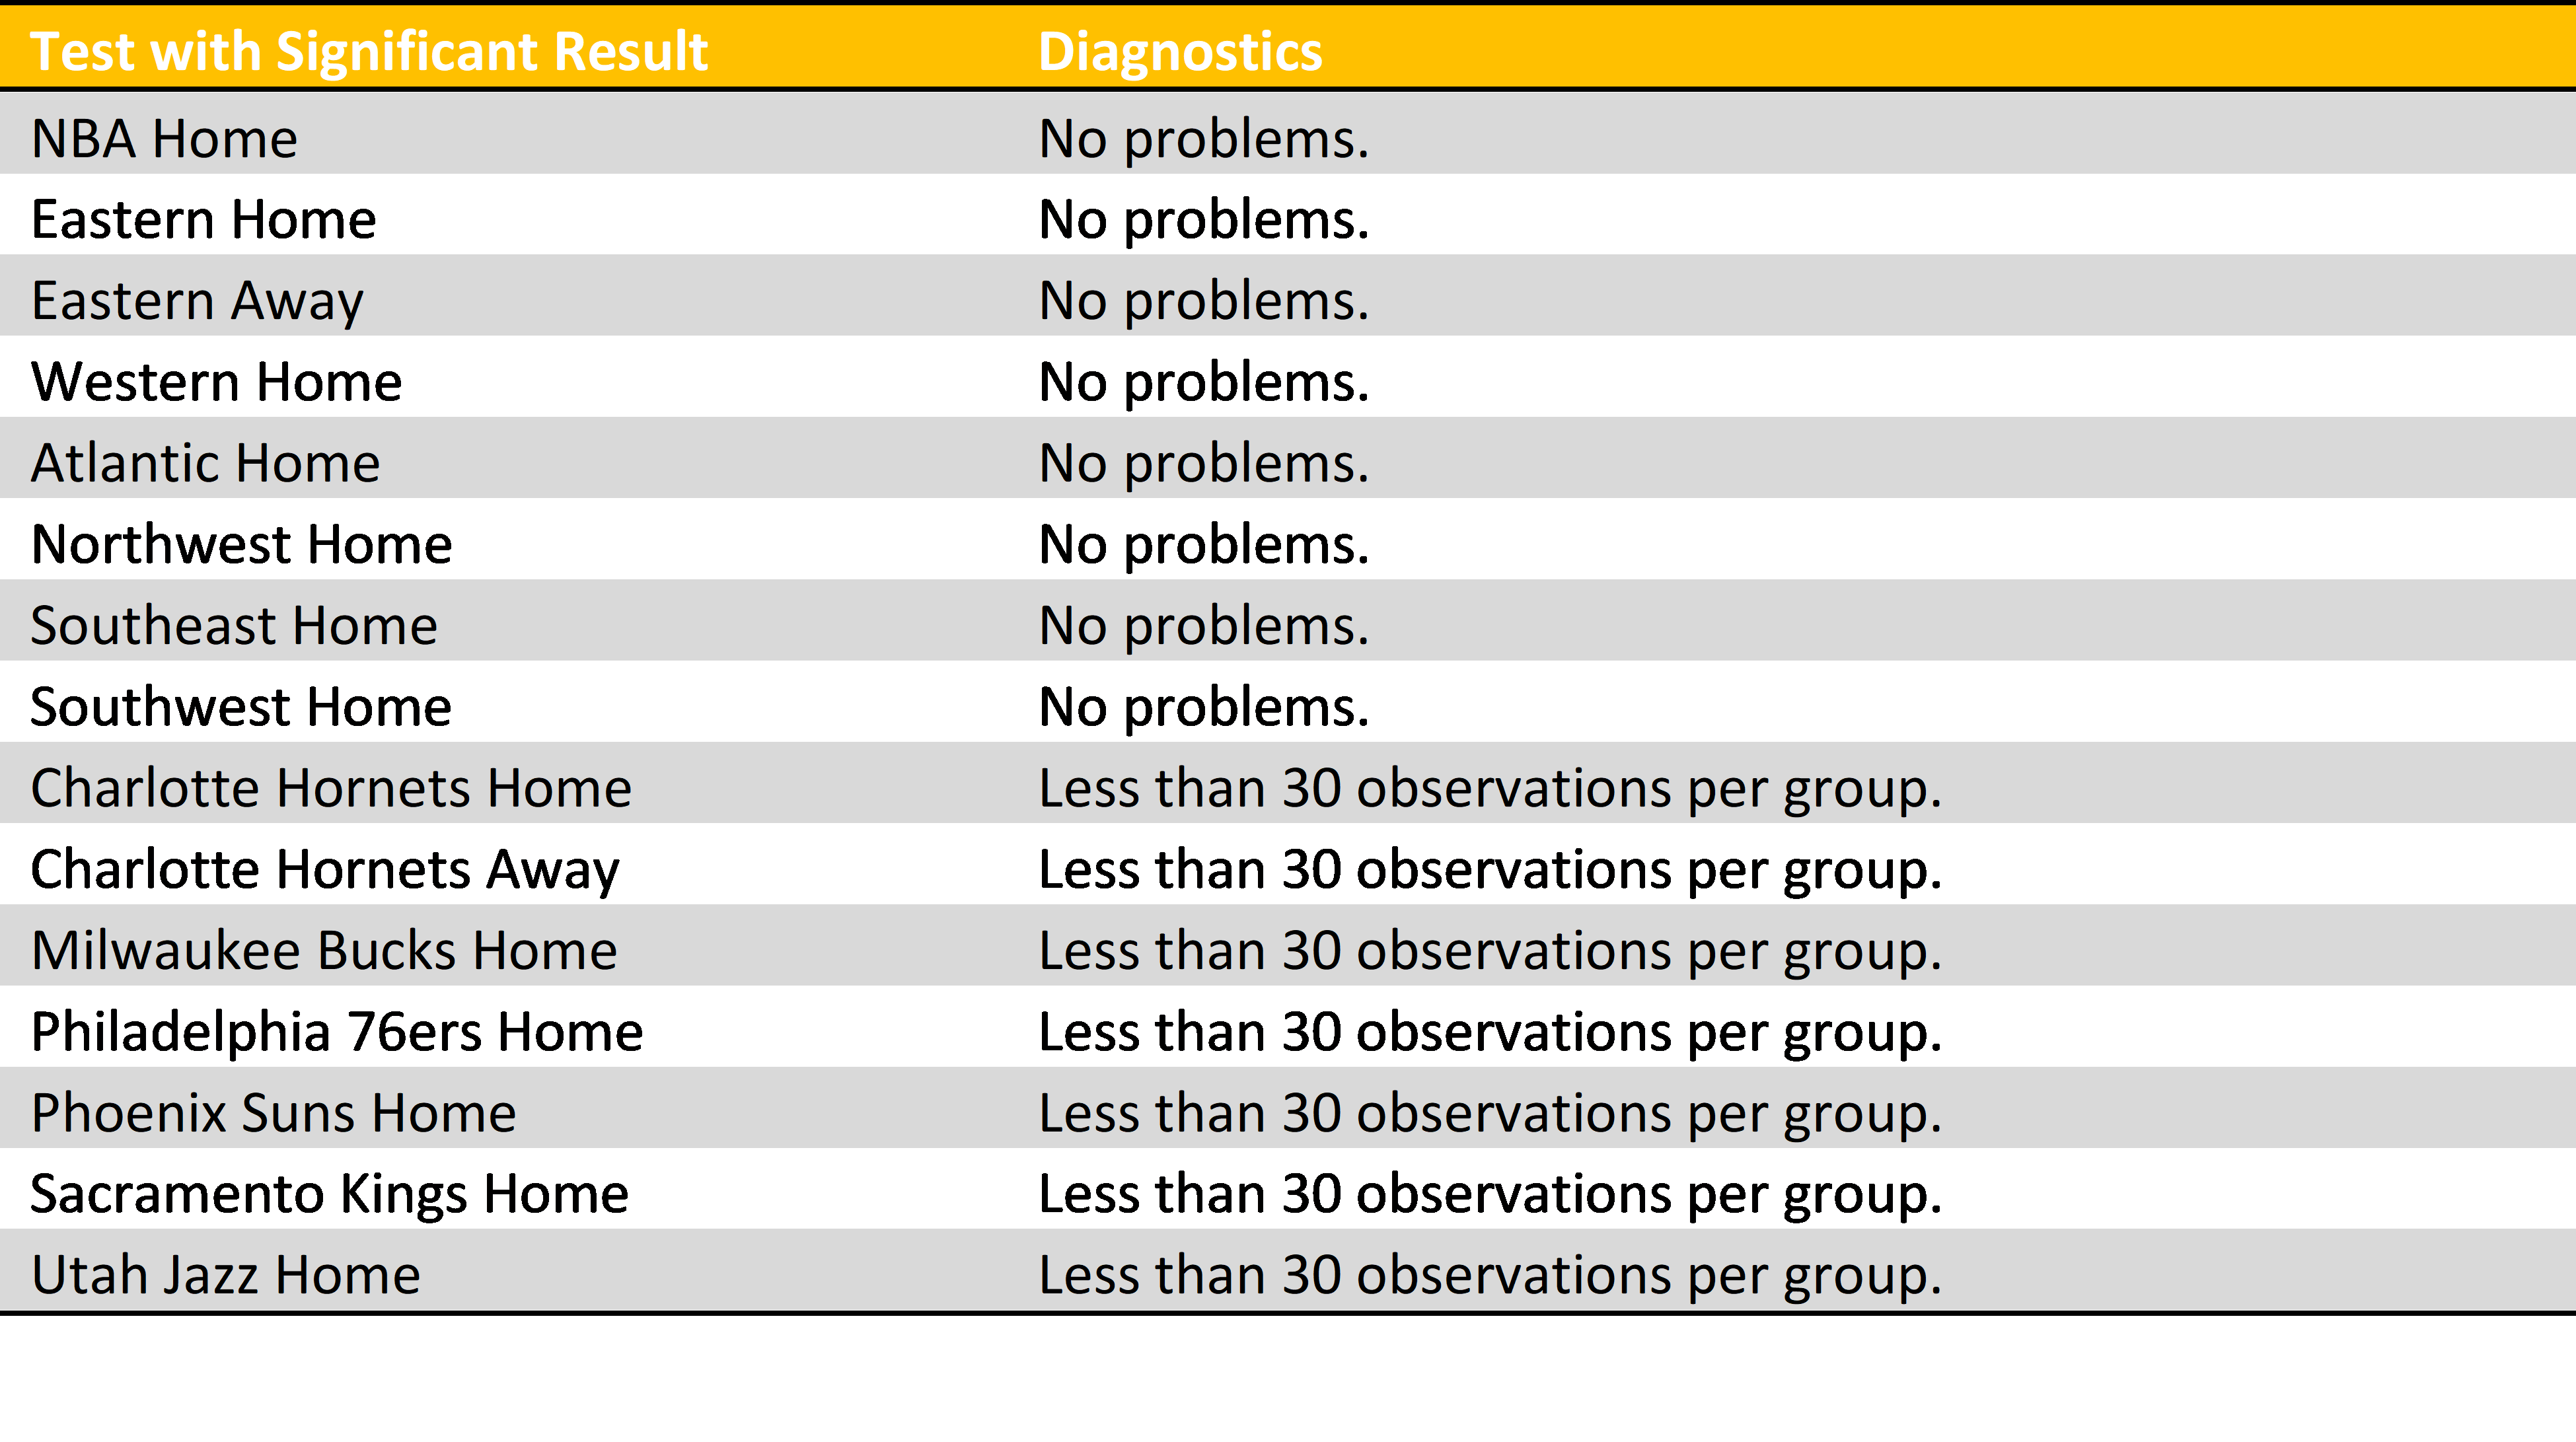
Table 2: Results from diagnostic tests done on models found to be significant.
We can see from Table 1 that there does not seem to be any trend in in the subsets. There are exactly three teams from each conference and two divisions from each conference with significant ANOVA tests results. This means that it is unlikely that one geographical region is more affected by the attendance than another region.
We can also tell from Table 1 that most of the significant tests involved the home team. The NBA as a whole seems to only exhibit a difference in points per game across attendance groups when considering home teams and only one of the two conferences exhibited the phenomenon while considering away teams. In fact, of six divisions, only four had a significant test result, all of which had to do with the home team. Furthermore, from thirty teams, only six exhibited significant test results (albeit with worrying diagnostics) and only one of those exhibited significant test results from a test done on their mean points scored as the visitors.
On Table 2 we can see that most tests had no diagnostic problems, but tests regarding individual teams do show problematic diagnostics.
Lastly, we can see Tukey plots analyzed in Table 3.
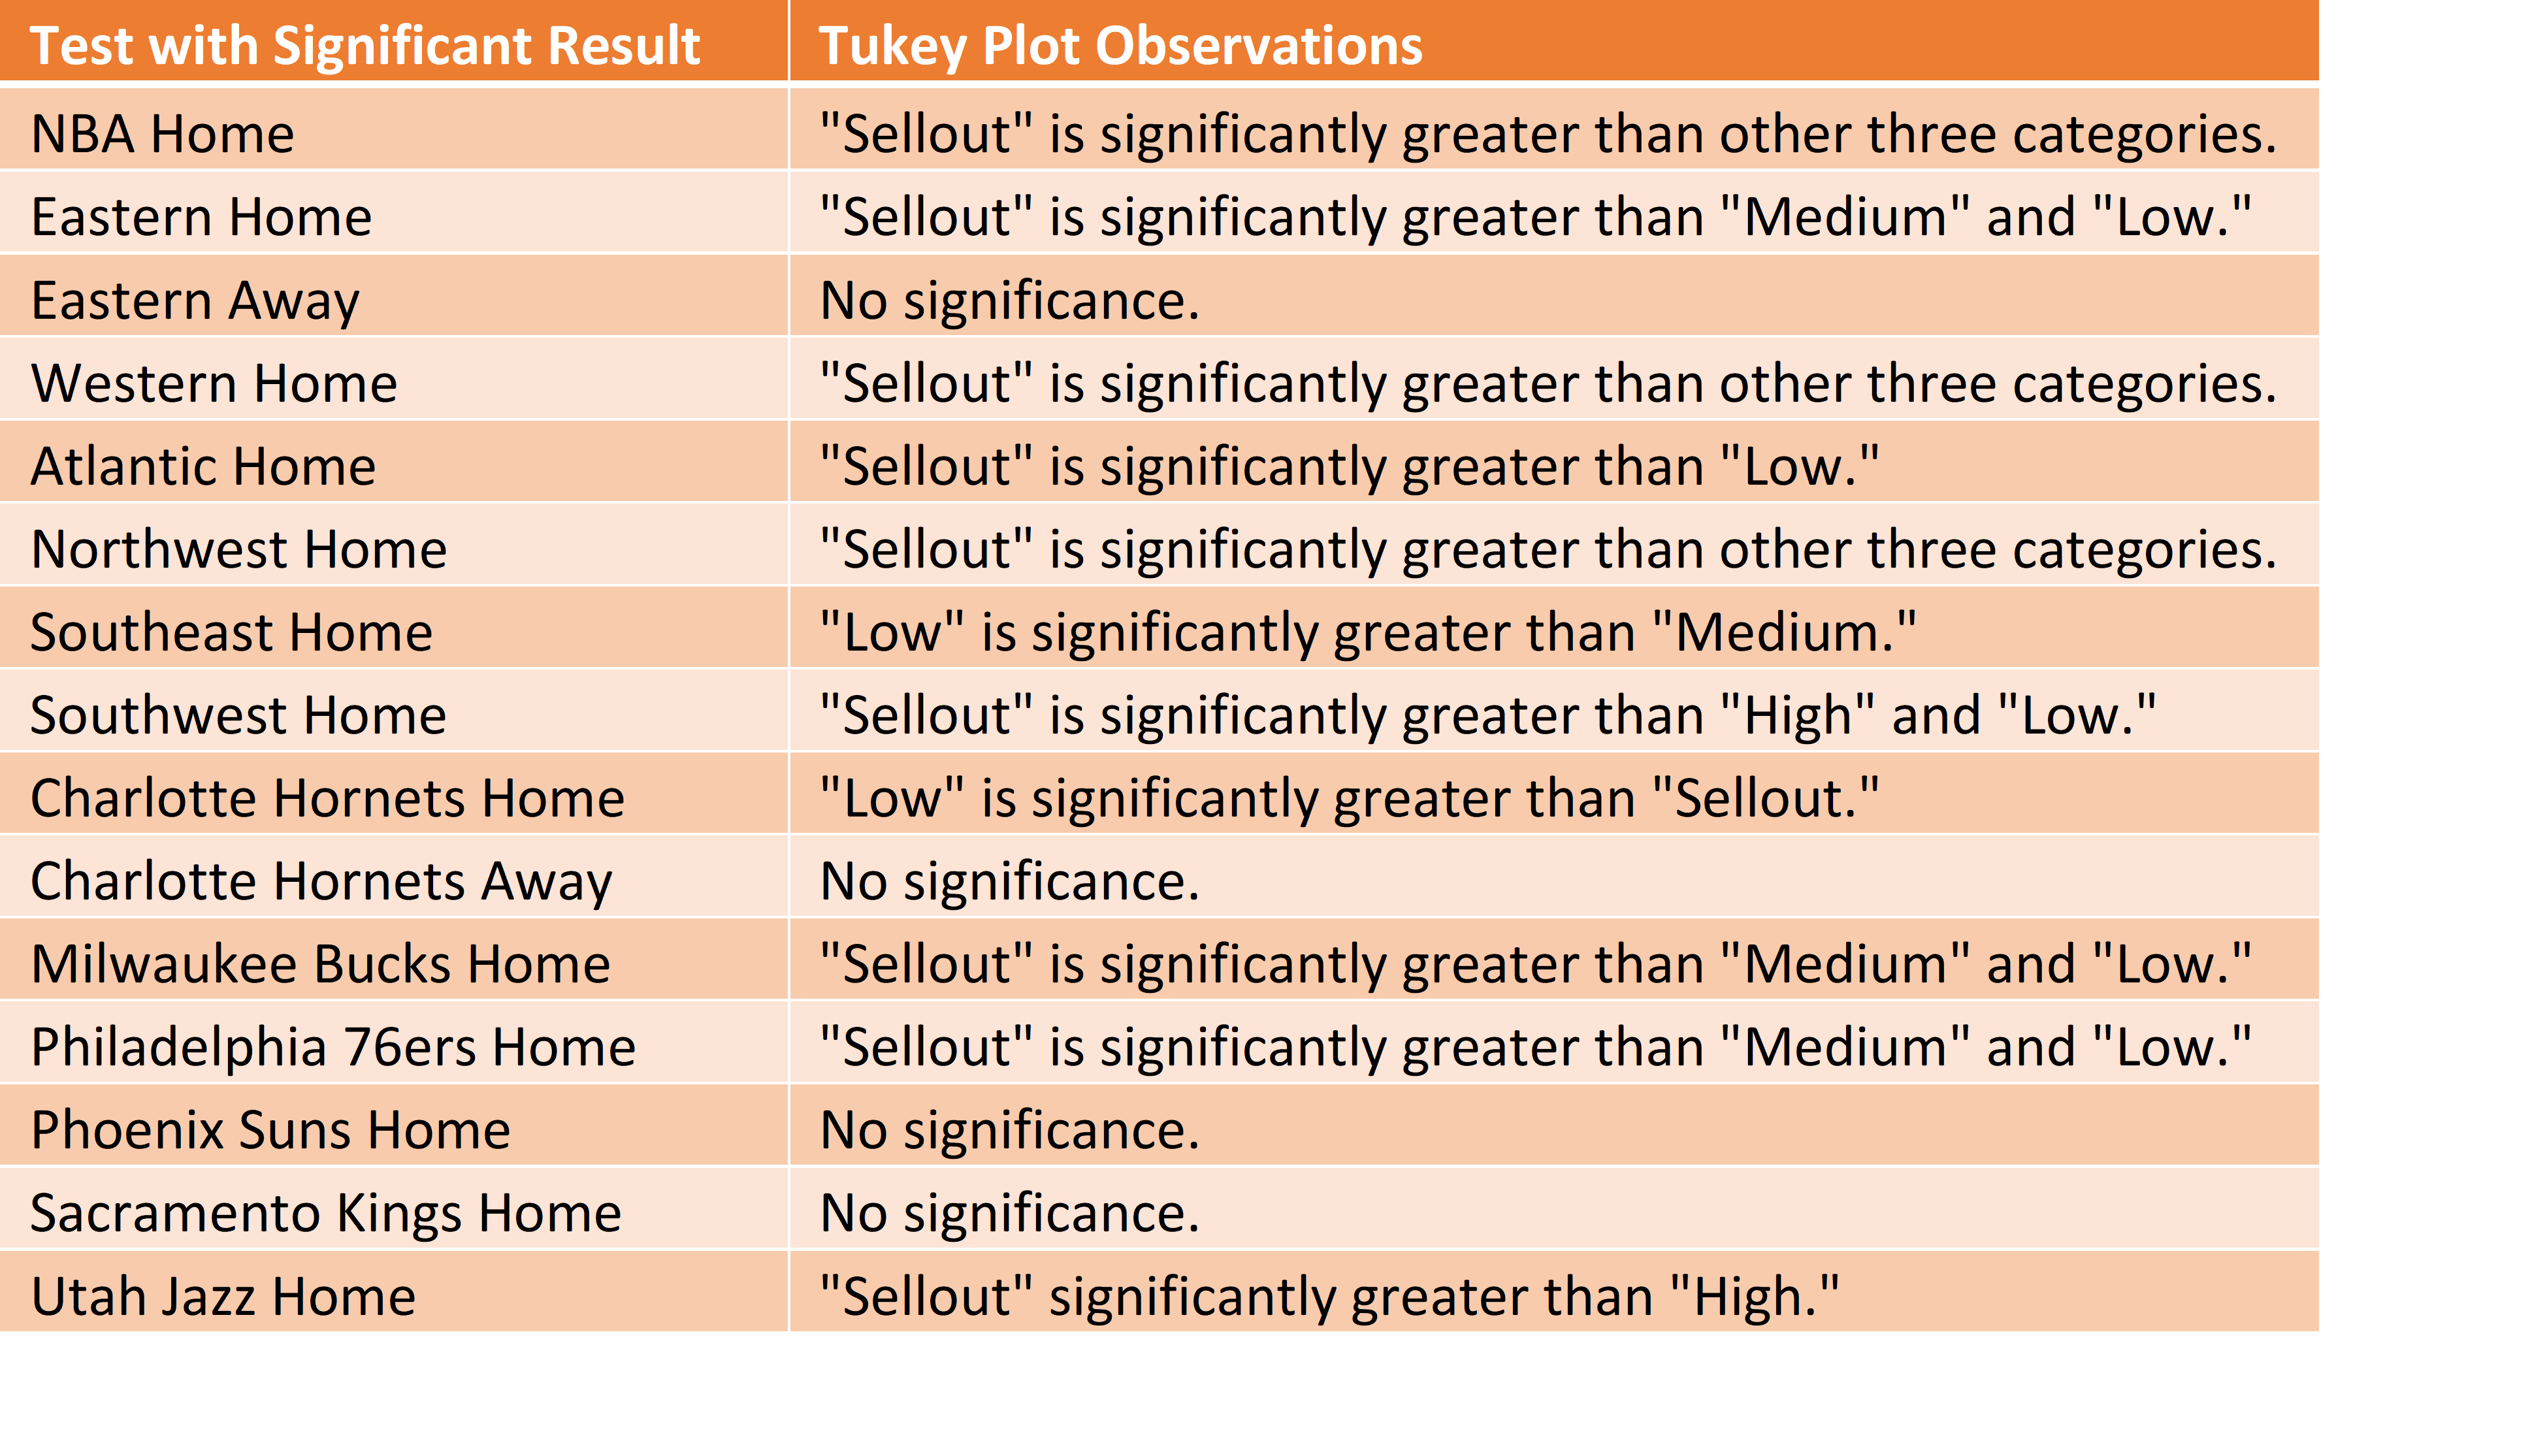
Table 3: Tukey plot results from models with significant test results
The results on Table 3 show the importance of selling out your games. In nine of the fifteen results shown, the “Sellout” percent group was the only group that held a significant advantage over any other group, and sometimes over multiple groups. In accordance with the bar plot we saw earlier, we fail to see games with “High” attendance have a significantly greater mean points per game than games with “Medium” or “Low” attendance and games with “Medium” attendance have a significantly greater mean points per game than games with “Low” attendance. Surprisingly, there are also two instances where the games with “Low” attendance had a significantly higher mean points per game than other groups.
Conclusion
We will first address our results from the linear models and ANOVA tests. We see that although there is significance there, only a small fraction of the league exhibited the phenomenon and the effect is very small. From this, we must conclude that close games might be affected by the fact that there will be no fanatics at the NBA bubble in Orlando, but the difference will not be game changing.
We also must explain what it means for the NBA and multiple other subsets of our dataset to exhibit a significant difference in mean points per game across attendance groups while at home and not as a visitor (see Table 1). It means that only half of our hypothesis was correct: it is true that home teams benefit from more fans, but we found little to suggest that visitors benefit from less fanatics attending. This might be for various reasons, but my hypothesis is that while a morale boost or referee bias might help get an extra trip to the free throw line or a loose ball, it is also true that NBA players are professionals that know how to handle pressure from the fans. For this reason, the home team exhibits an advantage whenever the audience increases, but the away team does not necessarily exhibit a disadvantage (the effect was not picked up by the ANOVA tests, but was picked up by the linear model).
Next, we look at the diagnostics and point out that none of the teams with significant test results had passed the diagnostic tests. We are left to wonder if increasing the dataset to cover more years could solve this problem, or if adding more seasons to the dataset would then make the model not significant.
Finally, we found the rather counterintuitive result: Charlotte and the Southeast Division benefited from “Low” attendance, as shown in Table 3. I have a hypothesis that explains these results. When bad teams are visited by good teams, there will be a bigger audience since the fans want to see the good team. Since the visitor is better, the home team will score less points, resulting in a small mean points per game. However, when that same home team plays against a worst opponent than the one described before, people will not be attracted to the game and will not attend. It is this lurking variable, opponent quality, and not attendance, that we see reflected in our study. Because the visitor is worse than the home team, the home team will score more points even if there are less fans in attendance. To support this hypothesis, we look at this year’s standings up until the 2020 hiatus. The Southeast division, who exhibited this phenomenon of playing better with less fans on their home court, only have one team over .500 and include the Charlotte Hornets, who themselves exhibited said phenomenon.
Further studies should look more into team quality, possibly by adding to the dataset the seed of both teams playing each game. They could also dive deeper into the issue of attendance, by using a dataset that includes referees and seeing how they are affected (effect in soccer studied by Harvard University). Lastly, a bigger dataset, possibly one covering the last ten or more years, will address the problem of insufficient observations in the smaller subsets.
About the Author
Gustavo Garcia-Franceschini will start his Sophomore year as a Statistics and Machine Learning major at Carnegie Mellon University this Fall. He looks forward to graduate studies and sees himself working for the data department on a sports team.
LinkedIn: www.linkedin.com/in/gustavo-garcia-franceschini
References
NBA.com Staff. June 4, 2020. “Everything you need to know about the 2019-2020 NBA season restart.” NBA.com. Retrieved from: https://www.nba.com/nba-returns-2020-faq
Harvard University. April 4, 2007. "Officiating Bias, Influenced By Crowds, Affects Home Field Advantage." ScienceDaily. Retrieved from: www.sciencedaily.com/releases/2007/04/070403112044.htm
NBA and ABA League Index. Retrieved from: https://www.basketball-reference.com/leagues/
ESPN. “NBA Attendance Report.” Retrieved from: https://www.espn.com/nba/attendance
NBA.com Staff. “2019-2020 Season League Standings.” Retrieved from: http://global.nba.com/standings/
Rstudio. Downloaded from: https://rstudio.com/products/rstudio/download/