New technologies drive baseball skill development
Now more than ever, technology is infiltrating the game of baseball. With the data-driven player development “revolution” in full swing, there has been an influx of products to this growing market space. From products that incorporate radar tracking technology to those with wearable sensors, players and coaches now have the ability to obtain vast amounts of individualized data in their pursuit of improvement. With such a large influx of new products to this market, it is important to ensure accuracy and validity of the data provided by those products. It is with this intent that Samford’s Center for Sports Analytics set out to validate a new product called the “pitchLogic” baseball by comparing its performance to popular products already established within the baseball industry.
What is pitchLogic?
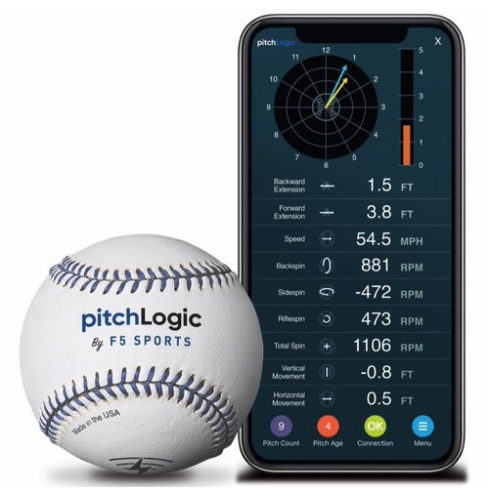
Created by F5 Sports, pitchLogic is a “smart” baseball that utilizes Bluetooth technology to connect to the pitchLogic mobile app. An internal IMU (inertial measurement unit) contained within each pitchLogic ball measures and outputs data points such as pitch speed, spin, and movement on a pitch-by-pitch basis. Pitch metrics are available for live viewing on the pitchLogic app, with the user able to tag pitch type and save the data for further examination.
Validation Process
In our pursuit of validation, we had a collegiate-level pitcher throw a 33-pitch bullpen using a pitchLogic ball. Along with the “smart” baseball’s readings, we also tracked the same 33 pitches with a Stalker Pro II radar gun and a Rapsodo 2.0 unit, a popular pitch-tracking unit that utilizes optical imaging technology. The Stalker and Rapsodo brands are renowned for their data accuracy and utilized by countless collegiate and professional teams across the country for scouting and player development. Each of these products, including the pitchLogic ball, capture metrics at the pitcher’s release point.
A Few Caveats
In the spirit of full disclosure, an ideal validation study would include a much larger dataset. Tracking a variety of different pitchers – with different pitches and approaches – across multiple bullpen sessions would provide a more ideal sample. However, due to the COVID-19 outbreak and subsequent cancellation of NCAA spring sports, we were unable to gain the desired sample at this time. We hope to revisit this validation at a later time and expand the dataset. Also of note, the IMU of a pitchLogic ball currently constitutes a need for a brief pause in between throws. Due to this, there were a few pitches in the bullpen that the pitchLogic ball did not read, most likely due to a lack of pause on the part of the pitcher. In fairness, the Stalker and Rapsodo units also produced several misreads, further limiting our dataset. Our validation results and subsequent analysis should be examined with these caveats in mind.
Velocity
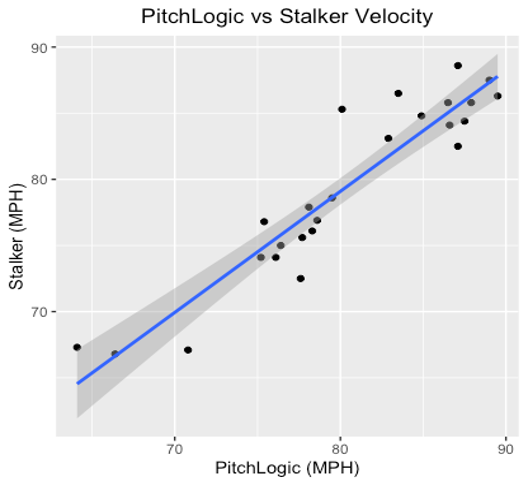
First, let’s compare the pitchLogic ball’s velocity readings and the readings of the Stalker Pro II Radar. Within our sample, the two measurement systems portray a strong correlation (0.936).
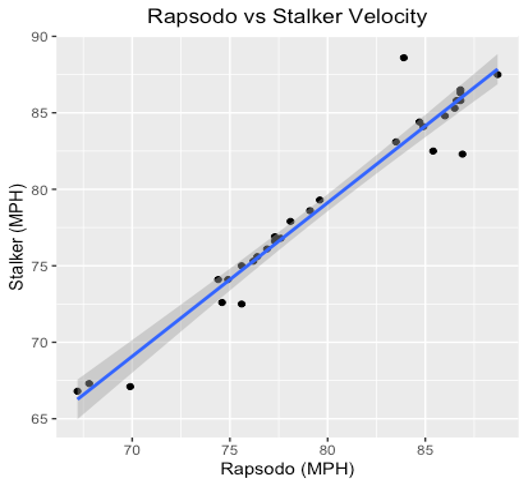
When comparing the Rapsodo’s velocity readings with the same Stalker Pro II readings, we see that Rapsodo has a slightly stronger correlation with Stalker (0.979).
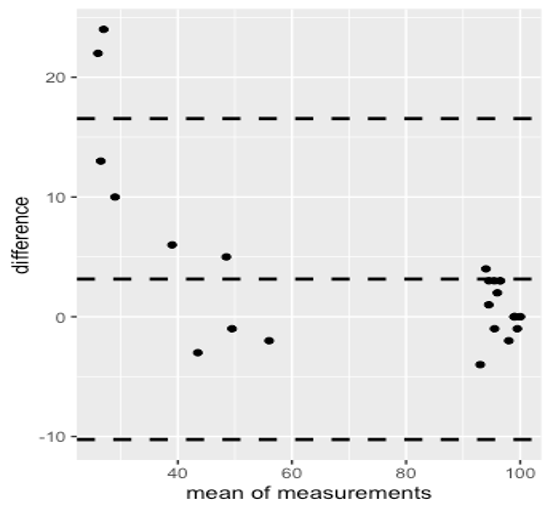
While simple correlation is useful in showing that two variables are in relation, it doesn’t fully examine the true differences in instrument readings on a pitch-by-pitch basis. Due to the fact that we are examining how two instruments read the same variable (each pitch during the bullpen session), we can utilize a Bland-Altman plot which measures differences versus means among the data provided by the two instruments. This can allow us to see if there are systematic biases or differences between the two paired sets of measurements provided.
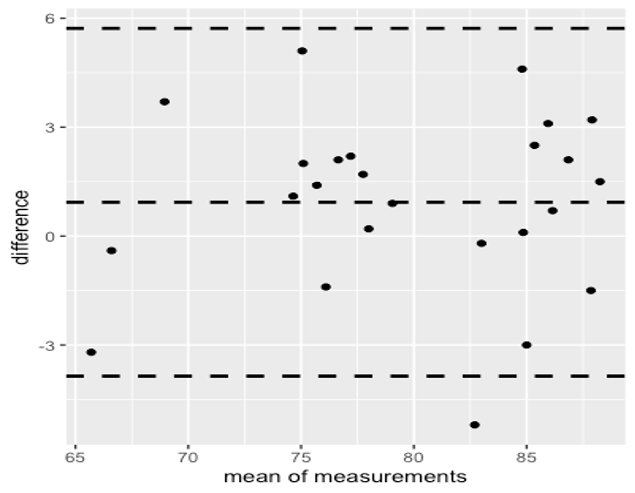
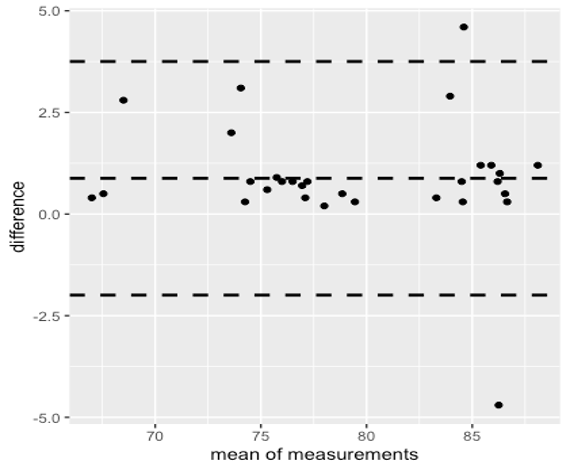
Included above is a Bland-Altman plot comparing the velocity readings of the pitchLogic ball paired with the velocity readings of the Stalker Pro II. The middle-dotted line indicates that the mean difference in velocity (pitchLogic velocity minus Stalker velocity) is 0.932 mph ± 0.92 mph at a 95% confidence interval. This indicates that the bias of a pitchLogic baseball is around 1 mph, which is relatively small. We can expect pitchLogic velocity readings around 1 mph higher than the Stalker radar gun, and we can have 95% confidence that the difference between the pitchLogic and Stalker velocity is between 0.012 and 1.852 mph.
Included below is a similar Bland-Altman plot, with the Rapsodo radar readings paired with the velocity readings of the Stalker Pro II. The mean difference in velocity in this case (Rapsodo velocity minus Stalker velocity) is 0.88 mph ± 0.547 mph at a 95% confidence interval. This suggests that the bias of a Rapsodo unit is around 0.88 mph, which is very similar to the pitchLogic baseball. However, the 95% confidence interval is slightly smaller than the interval for pitchLogic.
Total Spin
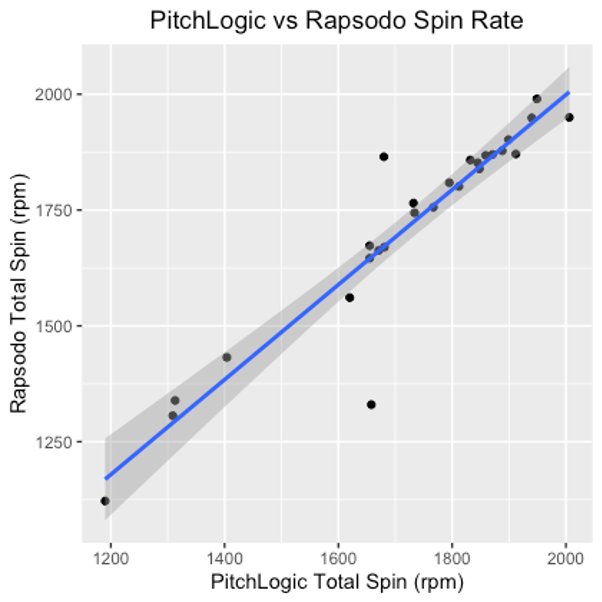
Similar to what we did with velocity, we can compare the ability of the pitchLogic ball to pick up spin rate to the spin rate readings of the Rapsodo unit. Within the sample, the pitchLogic and Rapsodo spin measurements show strong correlation (0.939).
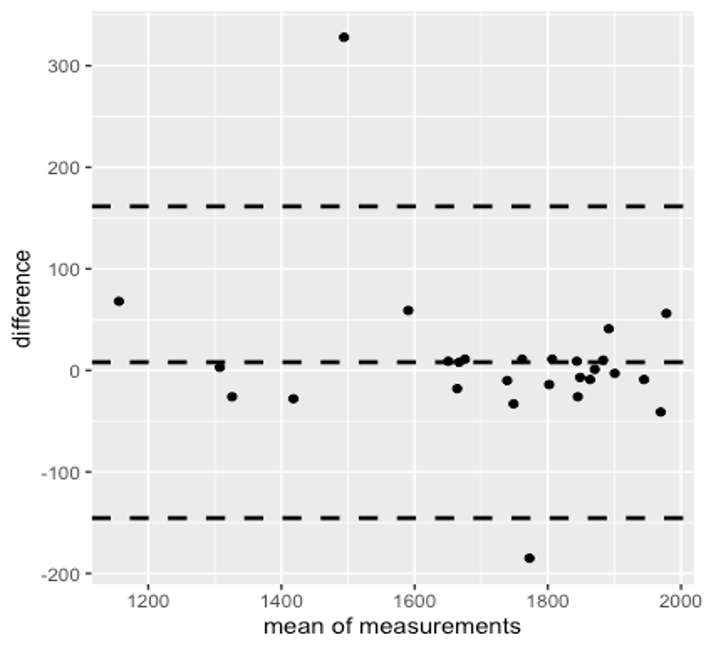
When we examine the Bland-Altman plot for the same two instruments, the mean difference in spin rate (pitchLogic spin minus Rapsodo spin) is 8 rpms ± 30 rpms (rpms = revolutions per minute). This bias of 8 rpms is extremely miniscule, as rpms are almost always measured in the thousands (the average MLB fastball is around 2200 rpms).
Spin Efficiency and Direction
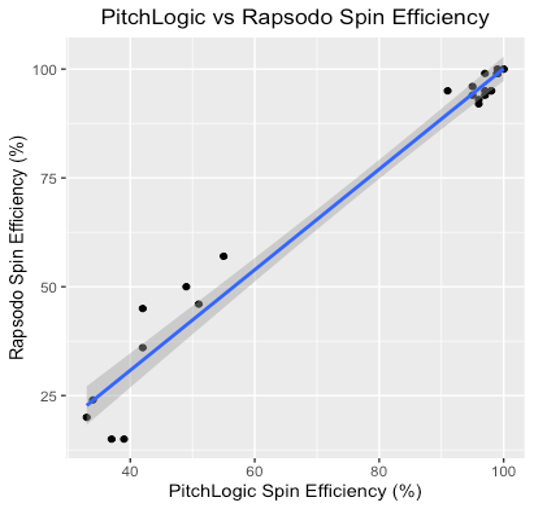
Two additional data points measured by both Rapsodo and pitchLogic are spin efficiency and spin direction. Spin efficiency essentially measures what percentage of total spin contributes to a ball’s movement. Spin direction is the direction of a ball’s spin (usually illustrated on a clock) after release as it travels to the plate. Spin efficiency measurements between Rapsodo and pitchLogic show strong correlation (0.985).
Upon examination of the Bland-Altman plot for the same sample, we find that the mean difference (pitchLogic spin efficiency minus Rapsodo spin efficiency) is 3.15 percent ± 2.7 percent. This bias, similar to the total spin bias, is relatively small.
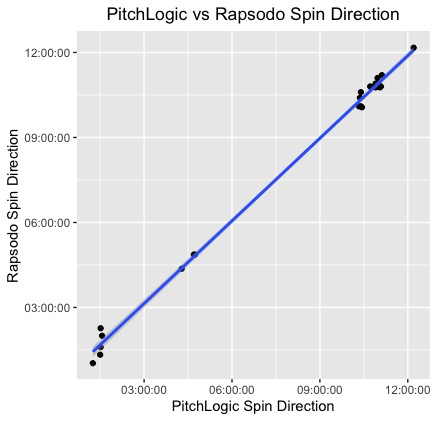
In terms of spin direction, pitchLogic and Rapsodo also strongly correlate (0.998).
Conclusions
The pitchLogic baseball seems to track relatively well with established radar units like Rapsodo and Stalker in terms of velocity, spin rate, spin efficiency, and spin direction. However, it is obvious that further study is needed to truly determine the extent to which its measurements can be compared to these other units. With the price of a single pitchLogic baseball much lower than the price of equipment like the Stalker and Rapsodo units, it can be a truly cost-effective option for coaches and players in their pursuit of data-driven development.
About
Mathew Bennett is a current MBA student and baseball player at Samford University. After achieving his MBA, Mathew hopes to work in analytics in some capacity within the sports industry.
Twitter: @mattyice_126
LinkedIn: https://www.linkedin.com/in/mathew-bennett-118714131/ or "Mathew Bennett"