
Giannis Antetokounmpo and the Milwaukee Bucks took the 2019 NBA season by storm. After a subpar 2018 season, where they won 44 games and barely made the playoffs, the Bucks managed to finish the 2019 regular season with 60 wins and clinch the 1-seed in the Eastern Conference. How did they find such success? How can other teams mimic their success? To answer this question, I ran multiple regressions to see which single statistic was paramount to success in the NBA and here’s what I found.
Points
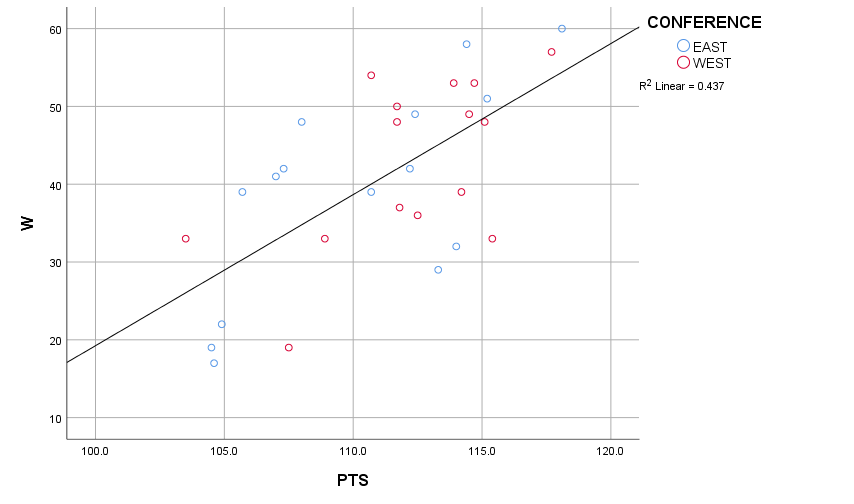
With an r-value of 0.661, points were the best predictor of wins among the five selected categories. This is highlighted by 6 of the top-10 winningest teams also being top-10 in points per game. I also want to point out the noticeable difference between the two conferences. Notice the right side of the board is dominated by red dots, which indicate western conference teams, while the left side has more blue dots, which indicate eastern conference teams. The western conference outscored eastern conference teams by an average of 2.1 points per game.
Field Goal % and 3-Point %
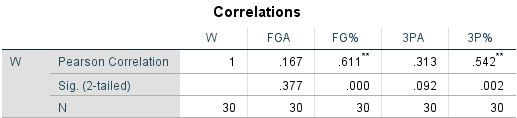
While scoring points plays a significant role in winning, the efficiency and manner in which you score is almost equally important. In my tests, Field Goal % has an r-value of .611 and 3-Point % an r-value of .542. Those numbers rank second and fourth, respectively, among the categories evaluated. Essentially, the amount of shots a team takes doesn’t necessarily matter when it comes to wins, but efficiency does.
Eight teams in the top 10 in field goal percentage made the playoffs, but only four of the top 10 teams in field goal attempts found their way to the postseason. However, seven of the top-10 teams in 3-Point Attempts found their way into the playoffs, and nine of the top-10 teams in 3-Point % made their way into the postseason.
This shows that while overall efficiency is an important role in winning games, efficiency from beyond the arc is the big underlying factor.
Defensive Rebounds (Second Chance Points)
Rebounding is actually more important than people may think when it comes to winning games. With an r-value of .529, rebounding had the third highest correlation with winning, and rightfully so.

It's simple. More rebounds puts the ball in your hands more, giving your team more chances to score. This is exemplified in the top-3 rebounding teams also being top-10 performers in field goal attempts, points per game, and total wins. A scatter-plot matrix is shown below

Assists (Relate To Efficiency)
Another statline that had correlated with winning was assists, having an r-value of .498. There is a small positive correlation here, but it is small. For example, the Hawks, Wizards, and Pelicans all finished top-10 in assist, but none of these teams made the playoffs. Actually, they were among the worst in the league.
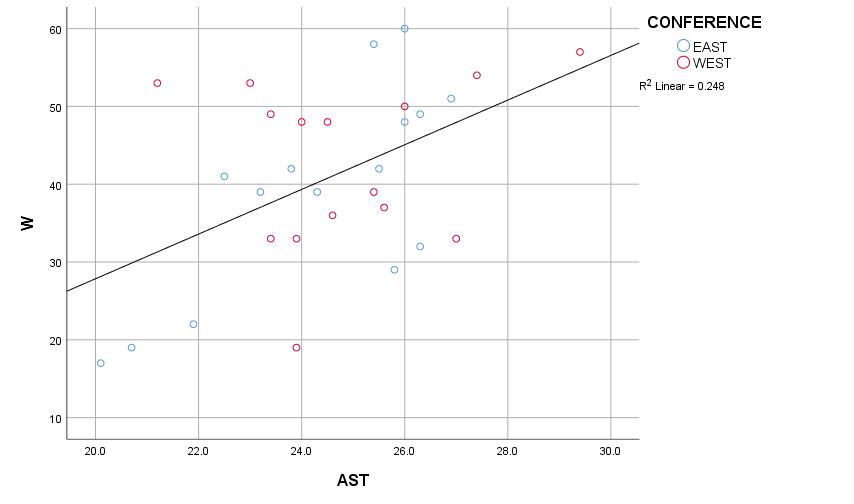
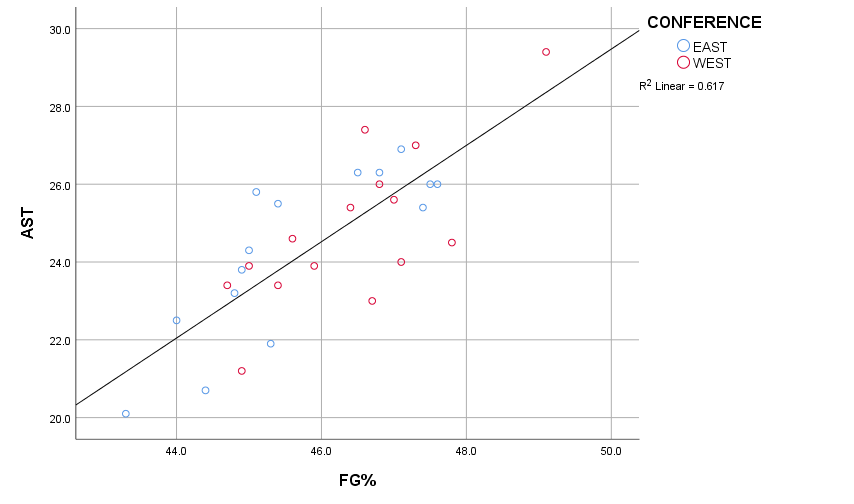
The reason I included this was metric was not because of its correlation with winning, but its correlation with field goal %, which as we saw earlier was highly correlated with wins. The correlation between assists and field goal percentage was very high, having an r-value of .786. The red on the top right side of the scatter-plot represents the Golden State Warriors. The Warriors averaged a 3-point % three percentage points higher than the league average and averaged 4.8 more assists per game. It is no surprise that this team finished top-3 in both wins and points per game
Results
Going into my analysis I was hoping to find one, maybe two definitive stat categories that I could say is most important when it comes to winning, but that wasn’t the case. Fact is, even though points per game had the highest correlation with winning, there are some teams which failed despite having a high scoring offense. For example, the Pelicans finished 3rd in points per game and 6th in field goal percentage, but finished the season at 24th in totals wins. On the other hand, teams like the Pacers showcased a subpar offensive showing, but used aggressive defense to carry them to 11th in total wins.
This shows that having an efficient offense doesn’t guarantee success, but out of the categories analyzed, it is most likely to translate in the standings. A team that can find relative success in all aspects of the game will be the team that wins the most, and in the 2018-2019 regular season that was the Milwuakee Bucks. After analyzing the 22 statistical categories, I found that the Bucks finished in the top-10 in 13 of them.
Each category carries some importance. I’m not going to say that teams should focus on scoring or that defense doesn’t matter. Success in one realm doesn’t guarantee a winning record. A team could score 150 points per game and still finish in the middle of the standings if it fails in other statistical categories. With that said, this exercise simply determined which categories are the best predictors of a winning record, not which ones a team must excel in to guarantee a win.
Source
https://stats.nba.com/teams/traditional/?sort=W_PCT&dir=-1
About the Author
Samuel Obi is a 2020 graduate of the Brock School of Business. In his time at Samford, he spent 2 years as an undergraduate assistant for the Samford Men’s Basketball program. While he earned his degree in Finance, he was very interested in data analytics, mainly sports analytics. He plans to use his data analytics skills to propel him to a coaching position in NCAA basketball.