According to the Merriam-Webster Dictionary, an all-star is “an outstanding or highly regarded performer within a field” (Merriam-Webster). Thus, the MLB All-Star Game is a competition between the best baseball players from both leagues. The Midsummer Classic has been around for almost eight decades, providing fans a chance to see all the best players compete on one field.
However, this is not always the case. Sometimes, average or even below replacement level players find their way onto All-Star rosters. This begs the question: are MLB All-Stars the best of the best? In this study, All-Stars and the best of the rest are compared to see who is better.
Background
A player can make the MLB All-Star Game in several ways. The first method is via fan voting. MLB fans can vote for the starting outfield players, including a designated hitter for the American League (AL). This vote sets the first eight National League (NL) and the first nine AL roster spots. Then, the players pick eight pitchers and a backup for every outfield position for each league, filling the next sixteen NL and seventeen AL spots. Following this, the managers and league office select four pitchers from each league, four outfield players from the NL (including designated hitter picks), and two outfield players from the AL. Finally, one player is chosen for the Final Vote, based on a five-person roster determined by the league. Once the list is put together, the fans select this final player. (Castrovince)
The several voting methods can lead to some controversies. First, the fan voting round has been under dispute for potential ballot stuffing by the biggest fanbases. The most recent example was in 2015, when some players questioned the voting after eight of the nine AL starting positions were initially taken by Kansas City Royals players (Chadiha). Also, before 2017, the All-Star Game manager got a vote during the third round of voting, which led to controversies over favoritism (Castrovince). Finally, by the time the manager round ends, the rosters must represent every MLB team. This requirement limits the number of All-Stars from a single team, restricting options for some deserving players. These controversies are just some of the methods that players can be overlooked in voting.
Players can also be chosen in their final seasons as a gift to players with long careers, regardless of their performance. In 2014, Derek Jeter was voted as an All-Star starter. Yet, he was one of the worst shortstops in the American League entering the game; his 0.6 Baseball-Reference Wins Above Replacement (bWAR) was 13th out of the fifteen shortstops in the AL (Paine). Jeter’s vote was partly due to his upcoming retirement at the end of the 2014 season and partly because he was a great shortstop across his career. Jeter is not even the worst starter in the game’s history; four starters entered the All-Star Game with a negative bWAR (Paine). Since a bWAR of 0 represents a replacement-level player, four players deemed below replacement level made the MLB All-Star Game and earned a starting spot in the lineup.
All the quirks and rules behind All-Star Game roster construction creates rosters that do not represent the MLB’s best. However, many of the best MLB players do end up being chosen. So, which player pool is best: MLB All-Stars or the best non-All-Stars?
Design
In this study, 1302 MLB players from the 1999-2019 seasons were studied. This player pool includes every field player and designated hitter selected to the All-Star Game, according to Baseball-Reference. Then, the two best players at every field position and designated hitter were chosen from each season to represent the non-All-Star player pool. For each player, several statistics were collected, including the triple slash statistics: batting average (BA), on-base percentage (OBP), and slugging percentage (SLG), along with on-base plus slugging (OPS). Two advanced statistics were also tracked: player bWAR, which was also used to determine the “best” non-All Stars, and OPS+, a statistic that normalizes standard OPS to compare across eras.
Since other statistics are stronger indicators of pitcher success, pitchers were not included in the study. Also, since All-Star reserves for outfield players are listed as “outfield” and not their position (left field, center field, and right field), all outfielders were combined into one position. As a result, the top six non-All-Star outfielders were tracked for each season to maintain a level field.
Following the data collection, a series of two-sample T-tests were run, comparing the All-Stars and non-All-Star for each position and statistic individually. Each alternative hypothesis assumed that All-Stars outperformed the non-All-Stars, and conclusions were based on this assumption at the 95% confidence level. Since the player samples came from the same population, pooled variance was used for these tests.
- Triple Slash Comparisons
For the triple slash statistics (BA/OBP/SLG), several All-Star groups hold up well to the non-All-Stars, albeit not significantly so. The only positions where All-Stars fail to have a statistically significant higher batting average are catchers and third basemen. All-Stars perform worse farther down the slash line; All-Stars win the OBP battle in only two of the seven positions (outfielders and designated hitters), and only All-Star outfielders out-slug their non-All-Star counterparts.
Although very few All-Star positions have a significantly larger value for these statistics, All-Stars outperform non-All-Stars often. Out of every position three triple slash statistic, only four pairs see non-All-Stars beat All-Stars: OBP and SLG for catchers, and BA and OBP for third basemen.
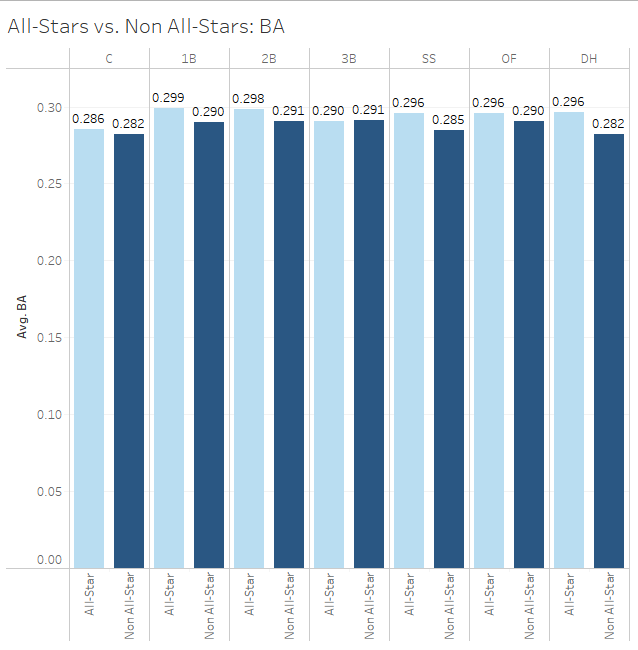
Batting Average Comparison by Position
- OPS and OPS+
The second part of the study focused on OPS and its advanced partner, OPS+. With these statistics, a trend emerges. All-Star second basemen and All-Star outfielders perform significantly better than their non-All-Star counterparts in both statistics. However, this is not the case for any other position, regardless of statistic. Since OPS+ attempts to define how much better a player is at hitting above the league average using OPS, it can be concluded that the only positions where All-Stars are significantly better hitters than non-All-Stars are second basemen and outfielders.
Despite this, most All-Stars outperform the non-All-Stars. For OPS, the only position where non-All-Stars outhit All-Stars is catcher. For OPS+, non-All-Star catchers and third basemen beat the All-Stars.
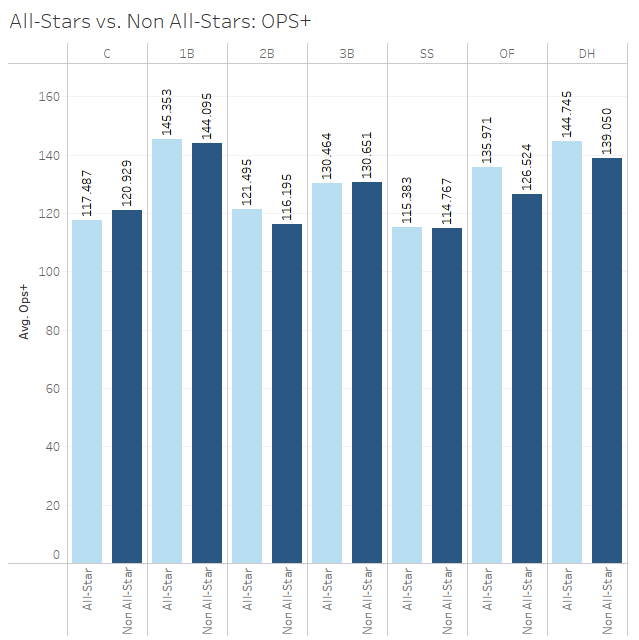
OPS+ Comparison by Position
- bWAR
The final part of the study looks at bWAR. Since bWAR assigns a value to all players based on all aspects of play, a higher bWAR is a good indicator of a player’s skill and abilities. However, when comparing All-Stars to non-All-Stars, the All-Stars fail to live up to their moniker.
Not a single position’s All-Stars significantly outperform the non-All-Stars. Not only that, but the only position where All-Stars have a higher bWAR in any capacity is at designated hitter. Most positions see a significant drop-off from the non-All-Stars to the All-Stars. As a result, All-Stars are not more valuable based on this statistic, with the sole exception of All-Star designated hitters.
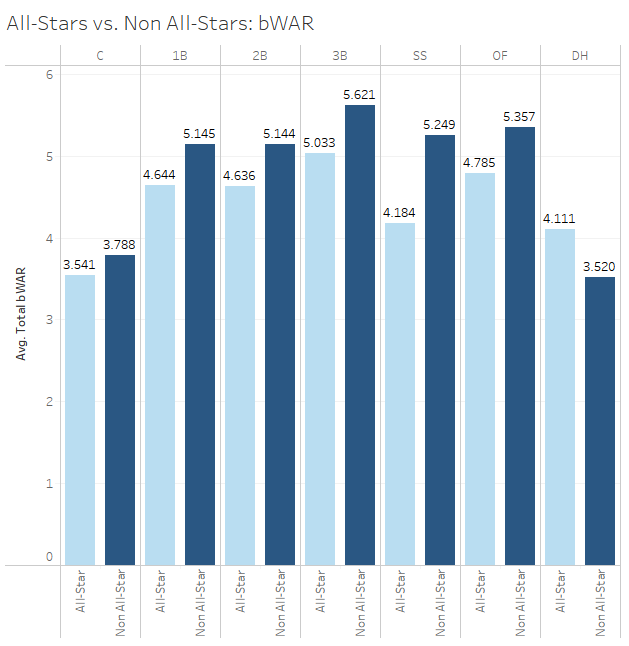
bWAR Comparison by Position
Conclusion
Overall, there is a solid argument to be made that the best non-All-Stars are as good as, if not better than, the actual MLB All-Stars. The All-Star Game is not a game with the best of the best in baseball, especially not by the end of the season. However, some positions have better All-Star representation than others. The best example of this is with All-Star outfielders, who significantly perform better than non-All-Stars in every statistic except for bWAR. Another position where the All-Star bids are most accurate is designated hitter, as All-Star designated hitters outperform non-All-Star designated hitters in every statistic.
However, some positions have much weaker All-Stars. The worst positions for All-Star choices are third basemen and catchers. For these positions, All-Stars are not significantly better than non-All-Stars for any statistic. Also, the only statistic where All-Star catchers are better than non-All-Star catchers to any extent is batting average. All-Star third basemen are slightly better in this study; the All-Stars outperform non-All-Stars in OPS and SLG.
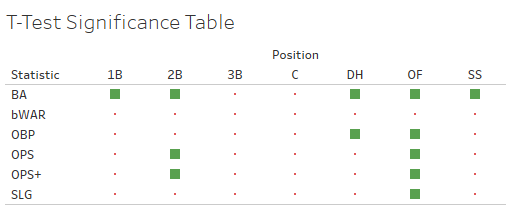
Results of T-Tests. A green square indicates that All-Stars significantly outperform non-All-Stars via the T-Test.
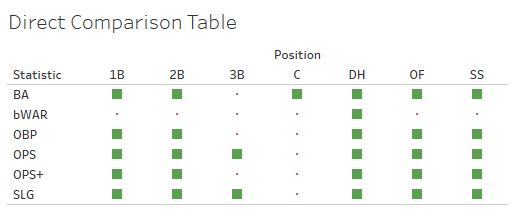
Direct Comparisons between All-Stars and non-All-Stars. A green square indicates that the average All-Star is better than the average non-All-Star.
Bibliography
Castrovince, A. (2019, June 30). All-Star FAQ: All you need to know on rosters. Retrieved from https://www.mlb.com/news/all-star-game-roster-rules-faq-c239654292.
Chadiha, J. (2015, June 16). Royals ruling All-Star voting for multiple reasons, all legit. In ESPN. Retrieved from https://www.espn.com/mlb/story/_/id/13093905/why-kansas-city-royals-dominating-mlb-all-star-game-voting.
Merriam-Webster. (n.d.). All-star. In Merriam-Webster.com dictionary. Retrieved June 7, 2021, from https://www.merriam-webster.com/dictionary/all-star.
Paine, N. (2014, July 15). Derek Jeter And the Other Worst All-Star Starters of the Past 40 Years. In FiveThirtyEight. Retrieved from https://fivethirtyeight.com/features/derek-jeter-and-the-other-worst-all-star-starters-of-the-past-40-years/.
About the Author
Alexander Harriman is a Senior Mathematical Sciences major at Clemson University. He plans to pursue a career in sports analytics, with the goal of performing analysis for a professional sports team.