Which position is the most important in football? Does offense or defense win Super Bowls? This is an evolving debate, and many teams have different approaches. We can analyze these different approaches by researching where National Football League (NFL) teams invest their financial resources. For this study, I investigate the eight Super Bowl champions from the 2013 through 2020 NFL seasons. To add to this study, I take a deeper look at roster construction by comparing two specific teams, the New England Patriots and Cleveland Browns. The Patriots have had consistent success through the years of analyses, with the one down year in 2020. The Browns were selected due to their noteworthy struggles, finally turning it around to make the playoffs last season.
Positional Salary Distribution Across the NFL
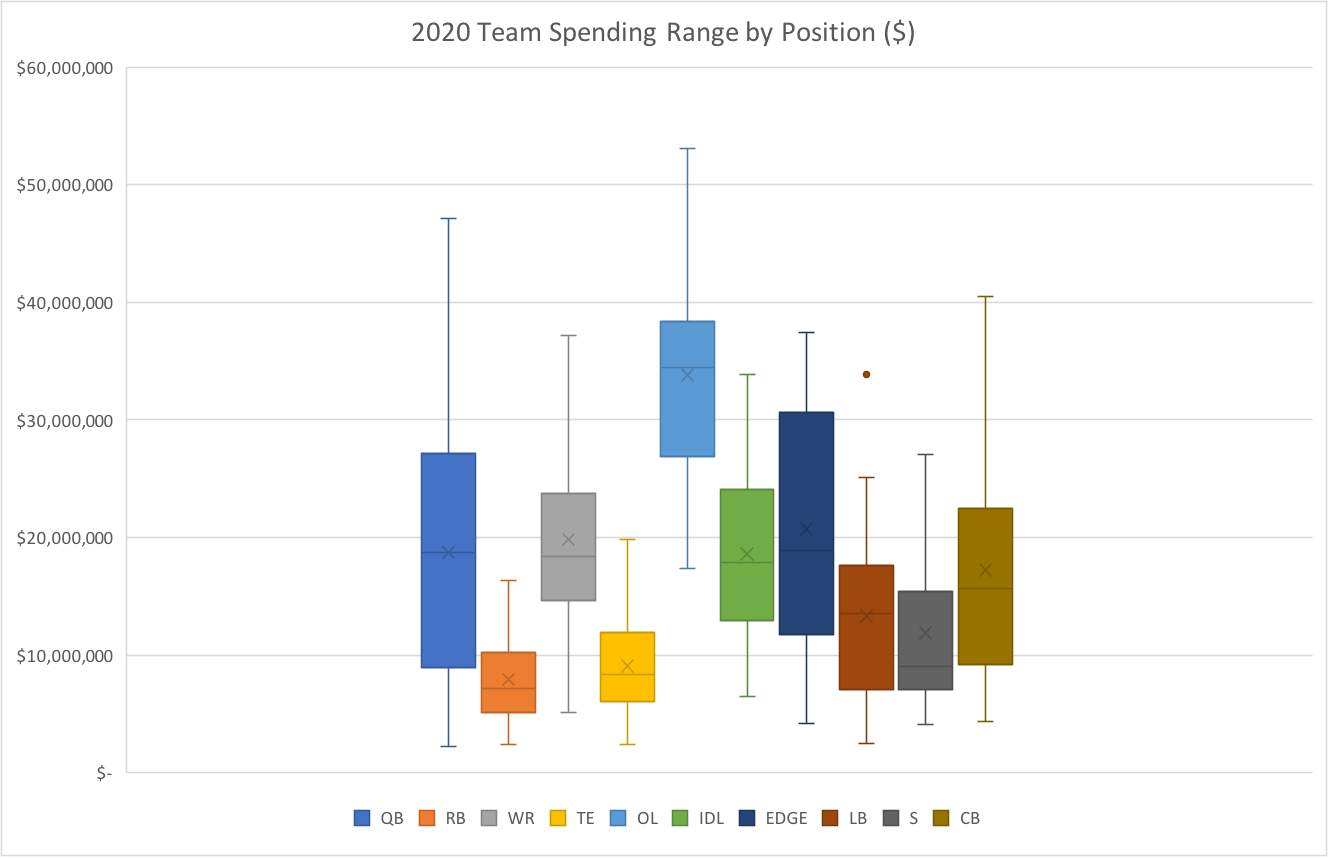
To start my inquiry, I collected NFL salaries for all NFL teams, broken down by position, for the 2020 season. Specialists (e.g., kickers, punters, long-snappers) were not included. The data comes from the website Over the Cap. The graph below details how all 32 NFL teams allocated their money in the most recent season, showing the ranges and mean of positional spending. Review of this data would suggest that NFL teams are moving towards more passing-oriented attacks and remain focused on stopping the passing attack. On offense, teams need a quarterback to throw, wide receivers to catch, and offensive linemen to protect the quarterback. On defense, teams need edge and interior defensive linemen to disrupt the quarterback and cornerbacks who can guard and lockdown the wide receivers.
Comparing Rosters of Super Bowl Champions
To continue my research, and focus on the most successful teams over the past few years, I again used Over the Cap to collect salary data on all Super Bowl champions over the previous eight seasons (2013-2020). When comparing teams across years, I used the percentage of total team spending per position group, rather than a specific dollar amount, in order to offset the changes in maximum salary cap teams were allowed each year.
Below is a list of the average positional spending (as a percentage of total salary) for all of the Super Bowl champion teams analyzed. The “edge” position includes both defensive ends and outside linebackers who play on the line of scrimmage. For example, Von Miller (who won Super Bowl MVP for the 2015 Denver Broncos) is included in the edge position. The linebacker position group only includes traditional, “off-the-ball” linebackers.
Total Offense – 56%Quarterback – 11%
Running Back – 4%
Wide Receiver – 13%
Tight End – 9%
Offensive Line -19%
Interior Defensive Line – 8%
Edge – 12%
Linebacker – 9%
Safety – 9%
Cornerback – 7%
The graph below shows the specific percentages of positional spending for each of the Super Bowl champs from 2013-2020, along with the average between these teams. It appears the old saying “defense wins championships” may be incorrect, at least for where front offices should invest. Every single Super Bowl champion during the eight years of study spends over 50% of their salaries on the offensive side of the ball. The 2014 New England Patriots had the lowest offensive percentage at 52% while the 2016 New England Patriots and 2019 Kansas City Chiefs had the highest at 60%. The average spending on offense across the eight Super Bowl champions is 56%. While some may still say defense wins championships, the data would seemingly support the notion that NFL teams need to invest more into the offensive side of the ball.
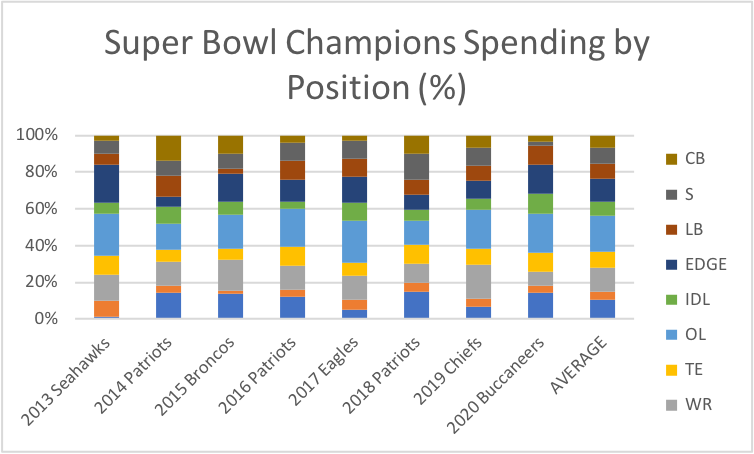
The offensive line always takes up the largest percentage. This is likely because the position group is typically the largest on a team. Quarterback often takes up a large percentage, except for several instances where talented QBs were still on their rookie contracts: Russell Wilson, 2013 Seahawks; Carson Wentz, 2017 Eagles; Patrick Mahomes, 2019 Chiefs. (After Wentz was injured late in the 2017 season, the Eagles won the championship with Nick Foles under center, though he was playing on a backup-level contract.) Running back is typically a low percentage of overall salary, while the wide receiver position demands more investment.
On the defensive side of the ball, no position sticks out as an extreme high or low, but edge is usually the highest paid position. Of course, defense is still extremely important. The 2013 Seattle Seahawks and 2016 New England Patriots won the Super Bowl led by the #1 ranked defense in the league. The 2020 Tampa Bay Buccaneers, the 2019 Kansas City Chiefs, the 2018 and 2014 New England Patriots won the Super Bowl with top 10 ranked defenses. The 2015 Denver Broncos and 2017 Philadelphia Eagles both won the Super Bowl led by their top 5 defenses. Obviously, teams need to have great defenses to win the Super Bowl, but teams should not be investing more money into the defense than the offense if they want to be successful. At the very least, this research suggests that offensive players are valued more, and therefore paid more.
Patriots versus Browns
After looking at the Super Bowl champs, and realizing the challenges of putting together a contending team, I wanted to take a more specific look by comparing two teams that have been at the opposite ends of success. The New England Patriots have been a model of success during the years included in this study (a 93-35 regular season record, 3 championships), while the Cleveland Browns have largely struggled (39-88-1 record, including an 0-16 season in 2017).
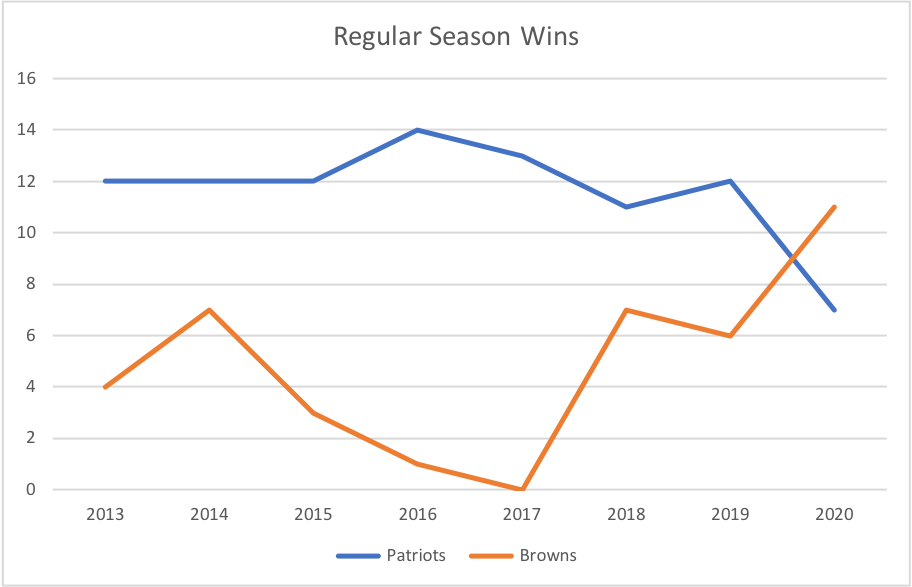
The graph below shows the difference in regular season wins between the two teams over the years. The Patriots won the Super Bowl in 2014, 2016, and 2018, as Browns were mired in a dreadful stretch of losing. The 2020 season was a turning point for both teams, as the Patriots missed the playoffs for the first time in 12 seasons and the Browns finally made the playoffs after an 18-season drought.
The success and failure stories of the Patriots and Browns agree with my earlier findings of the offense requiring a higher investment than the defense. The only two years the Patriots did not have over half of their money spent on offense was 2019, where they spent 50% on offense, and 2020, where their spending on offense dipped to 48%. In 2019 they reached the AFC championship and lost, but in 2020 they failed to reach the playoffs for the first time since 2008. On the other hand, the Browns spent three of the years investing more in defense than offense. In 2020, when they reached the playoffs for the first time since 2002, they had 56% of their team spending invested on the offensive side of the ball, which is the average of Super Bowl champions (2013-2020) identified from the earlier analysis.
One way the Patriots differ from the average recent Super Bowl champion is the way they invest on the defensive side of the ball. The Patriots have never invested heavily into the interior defensive line or edge positions as much as other champions have. The Patriots focused more on the off-ball linebackers and secondary. Last year, the Patriots had over a quarter of their funds invested in the cornerback position. That was half of their entire defensive spending. The Browns, on the other hand, invested heavily into the defense throughout the period, especially the interior defensive line and edge. In 2020 when the Browns finally reached the post season, edge was the highest defensive position, then cornerback, and then interior defensive line.
Even though Baker Mayfield is still playing on his rookie contract, the Browns’ offensive allocation of funds is starting to look more like the Super Bowl champions’ allocations with high investments on the offensive line and wide receiver position groups. Running back and tight end have the smallest salaries on the offense, and the linebacker and safety positions are the lowest on the defense. Last year, on the offensive side, the Patriots spent more on running backs than quarterbacks, while quarterbacks and tight ends had the same percentage of cap space. The Browns are finally heading in the right direction, while it seems the Patriots went astray and need to get back to their old ways.
Summary and Conclusion
There is a large question about which position is the most important to team success. Just by the money, offensive line is the most important position to the most successful teams, based on salaries. The issue with this statement is that the offensive line always has to have five players on the field. Other positions do not have that many players on the field as much. Quarterback is extremely important. Winning teams have a large amount of their money invested into this single player. The Patriots always had a large percent invested into their quarterback, Tom Brady. When he left, they missed the playoffs and only had two percent of their money invested into the quarterback position. The Browns, for the most part, never had a large percentage invested into the quarterback. The Browns have been noteworthy for their inconsistent quarterback play and frequent turnover at that position, and the data confirms their reluctance to identify and compensate top-tier talent at this important position. Perhaps Baker Mayfield, the number one overall pick in the 2018 draft, is finally their answer.
For the rest of the offensive positions, wide receiver is next for highest spending. This position group is similar to the offensive line where they can have three to four players on the field at once. Running backs and tight ends are paid relatively similarly, with running backs being consistently the lowest position between both sides of the ball. The general consensus for this low pay is that running backs’ bodies take such a beating in the NFL that it is not smart to invest heavily into this position because of the lack of longevity.
On the defensive side of the ball, there is not really one position that is consistently the highest paid. In recent seasons, edge defenders have been the most rewarded. This reflects the change in the NFL and how defenses have to try and stop high-powered passing attacks. Teams are doing this by investing in edge defenders to rush and disrupt the quarterback. Out of the entire league in 2020, cornerbacks had the highest maximum salaries on this side of the ball, but edge had more players with higher salaries. Traditional inside linebackers are not as popular throughout the league anymore. Off-ball linebackers and safeties are now sharing responsibilities between pass coverage and playing near the line of scrimmage. This is likely why the two positions had very similar spending in 2020. While not as highly paid as their edge counterparts, interior defensive line had high salaries in 2020 due to the disruption they can cause right in the quarterback’s face. The perfect example for this is Aaron Donald, the Los Angeles Rams’ defensive tackle who is widely considered the best defensive player today. His combination of strength and speed causes havoc in the backfield, enabling him to throw any offense off rhythm.
While this study can offer guidance on how successful teams invest their money, there are some issues. Teams can know which positions they need to spend the most money on, but that does not always guarantee the best players. Every single year there are players who sign large contracts who do not play up to the ability that the team expects based on the money they pay him. It is also true that players could take smaller contracts for any number of reasons, such as wanting to be on a winning team. Also important, rookie players have to play under the smaller rookie contracts, so rookie contract players can play above their financial value. For example, Patrick Mahomes had a value of $5,346,538 against the Chiefs’ cap in 2020 when he was under his rookie contract. For the 2022 season, when his contract extension goes into effect, he will have a value of $35,793,381 against the cap, and the value only gets higher for the rest of his contract. All these examples of players performing above or below their financial value negatively impact this study due to the players contributing more or less to team success based on their financial value to the team. This will always be a major part of team success as getting the best players for lesser money allows teams to acquire more talent. This shows the importance of having stellar drafts and contract negotiations.
References
2013 - 2020 NFL Opposition & Defensive Statistics. Pro Football Reference. (n.d.). https://www.pro-football-reference.com/years/2020/opp.htm
Positional Spending. Over the Cap. (n.d.). https://overthecap.com/positional-spending/
Patrick Mahomes. Over the Cap. (n.d.). https://overthecap.com/player/patrick-mahomes/5594/
Team Records, Leaders, and League Ranks. Pro Football Reference. (n.d.). https://www.pro-football-reference.com/teams/
About the Author
Peter Renkoski is a third-year Brock School of Business student from Roswell, Georgia, studying Economics with concentrations in Sports Analytics and Sports Marketing. Upon graduating in December of 2021, he plans to stay at Samford to pursue his MBA. He currently plays offensive line at Samford University and is a member of the Sigma Nu fraternity.
LinkedIn: https://www.linkedin.com/in/peter-renkoski-40854a17a/
Twitter: @PeterRenkoski