"0 New England Patriots quarterback Tom Brady" by Jack Kurzenknabe is marked with Public Domain Mark 1.0.
In football, there aren’t as many performance defining statistics that encapsulate what it means to succeed as a player as there are in baseball. That is why I set out to come up with a statistic to help do just that. Efficient is defined as achieving maximum productivity with minimum wasted effort or expense. I want to find a statistic that shows which quarterbacks are the most efficient at their jobs. I chose efficiency as a main focal point of this project because I think a passer who is one of the most efficient will also be one of the most successful.
Research
To begin the project, I looked to a few other existing statistics to help come to my conclusion.
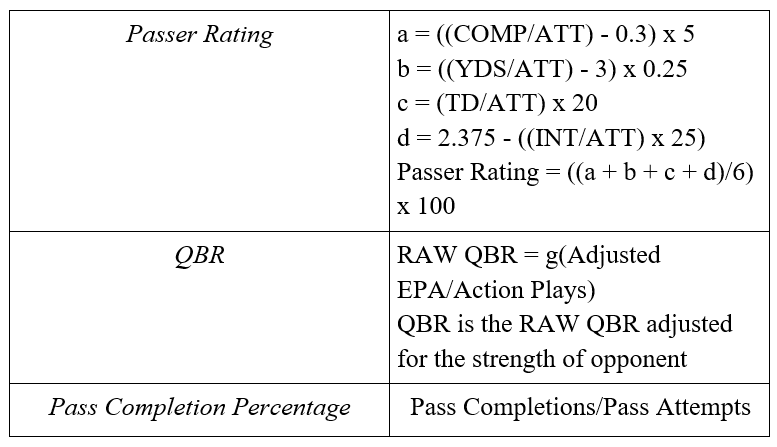
Passer Efficiency Rating: For passers, a well-known statistic is passer efficiency rating. It is calculated using a player's passing attempts, completions, yards, touchdowns, and interceptions. This rating operates on a scale, with the NFL scale ranging from 0 to 158.3. Typically league leaders by the end of the season are around 110, with some top players at the position exceeding this level. This statistic is often overlooked by older/more casual fans of the game, but offers great value by placing a passer’s performance into one encompassing statistic. If it succeeds at that is highly debatable. I included it in my quest to find the best statistic to determine efficiency, because while efficiency is literally in the name of the statistic, it’s certainly not flawless.
QBR: Another efficiency minded statistic for the quarterback position is Total Quarterback Rating (QBR). This is a much newer statistic, introduced in 2006. It was created by ESPN to be a more encompassing option to regular passer rating. A key difference between QBR and passer rating is that QBR takes into account game situation. This means success in an important situation boosts the rating more than a similar play in a less important moment of the game. It takes into account win probability, expected points, dividing credit, clutch index, and defensive adjustments, in addition to other factors. The fact that it considers game situations is quite promising, because almost everyone would agree that a quarterback’s performance in the fourth quarter of a tied game is more important than when their team is getting blown out. To simplify things, they made the QBR scale from 0-100. Current league leaders for this statistic are typically around 75, with a handful of players able to hit the mark of 80. While QBR hasn’t quite caught on as the all-encompassing statistic that ESPN might’ve wanted (like WAR for baseball), it’s still well respected by the media and in the league.
Pass Completion Percentage: The maximum productivity of a passer every time he releases the football is to complete the pass to a teammate. An incomplete pass would qualify as a wasted effort or expense. Therefore, another deserving statistic to include is pass completion percentage, which is calculated by dividing the number of passes completed by the number of pass attempts. Since this statistic is a percentage, it ranges from 0-100. Contemporary league leaders for a season typically rest in the high 60s. If a quarterback is able to get to 70%, that is a very impressive milestone, as it has only been done around 20 times in NFL history. A quarterback’s ability to complete passes is extremely important to his success since they have to successfully complete throws when moving the ball down field through the air.
A Method to the Madness: A New Football Statistic
Out of all the statistics that measure a passer’s performance, I felt these three represented reasonable measurements for efficiency. All are reputable and frequently cited, yet still imperfect indicators of a passer’s efficiency. Therefore, I aim to create a new statistic as a compilation of all three metrics: Efficiency Total. The Thought process on Efficiency Total is that it rewards passer’s for excelling in three of the most reputable statistics for a passer. If a quarterback exceeds in one, but not the other two, it will show in their Efficiency Total. It is meant to be a more encompassing statistic than all three of these are on their own. To calculate Efficiency Total, you take the sum of passer rating, QBR, and completion percentage. The maximum Efficiency Total (ET) for an NFL quarterback is 358.3 (passer rating: 158.3 + QBR: 100 + pass completion percentage: 100).
ET = passer rating + QBR + pass completion percentage
The criteria to qualify for each of the three statistical categories (QBR, passer rating, completion %), and therefore ET, is the same. A passer must have at least 14 pass attempts per scheduled team game. From 2006-2020, the passer must have at least 224 pass attempts that season (14 pass attempts x 16 games = 224). From 2021 going forward, that minimum number of pass attempts goes up to 238 (14 pass attempts x 17 games = 238).
Something worth mentioning about this statistic is that it can only be used as far back as 2006, due to QBR being introduced by ESPN that year. I don’t consider this to be a bad thing though, because most quarterback statistics have significantly inflated over time. This is due to the number of games increasing, or the very nature of the game itself. This makes it extremely difficult to compare passers from the 1980s to passers playing today, as the game is much more pass-heavy. For example, in 2021, the average number of passing yards per game for a quarterback was 228.3 yards, while in 1978, it was 158.8 yards. This makes it extremely difficult to compare players like Patrick Mahomes and Terry Bradshaw. This also goes to show why counting statistics (for example yards, touchdowns, etc.) can be very misleading when comparing quarterbacks of different eras.
Total counting statistics (passing yards/passing touchdowns, etc.) aren’t the only statistics that have inflated over time. The average pass completion percentage for a game in 2021 was 64.8%, while it was only 53.1% in 1978. This makes 1978 pass completion percentage leader Bob Griese’s 63.0% much more impressive than Andy Dalton’s 63.1% pass completion percentage in 2021, which was good for 25th best in the league (out 33 qualified quarterbacks). An advantage of the suggested ET statistic is that it minimizes the effects of changes in the league's rules/how it operates. Starting in 2021, the NFL expanded the regular season schedule from 16 to 17 games. In theory, this would make any of the total counting statistics easier to get a higher total for. The statistics that play into ET are per game averages, so realistically the impact that the expansion of the regular season schedule will have on ET is much less significant than the impact on passing yards/touchdowns. In using these three statistics, it allows for the comparisons of a passer’s ET from this season to a passer’s ET in 2006 much easier and more accurate.
Based on a compilation from each of the supporting metrics, I developed a chart showing what each range of ET score will typically mean for a player’s performance:
270 +: One of the Greatest Single Season Passing Performances of All Time
260-270: Easy MVP Winner(unless someone else is higher/player at another position wins)
250-260: Best Passer in the League, All Pro, Possibly MVP
240-250: Most likely top 5 Passer, Possibly All Pro
230-240: Pro Bowl
220-230: Borderline Pro Bowl
210-220: Above Average
200-210: Average
Below 200: Below Average
Results
I wanted to see how well each of the quarterbacks who ranked the highest in this category faired for that season, and if the same names would often appear. So, here are the top five in Efficiency Total for every season since 2006, as well as some of the accolades that they received that season.
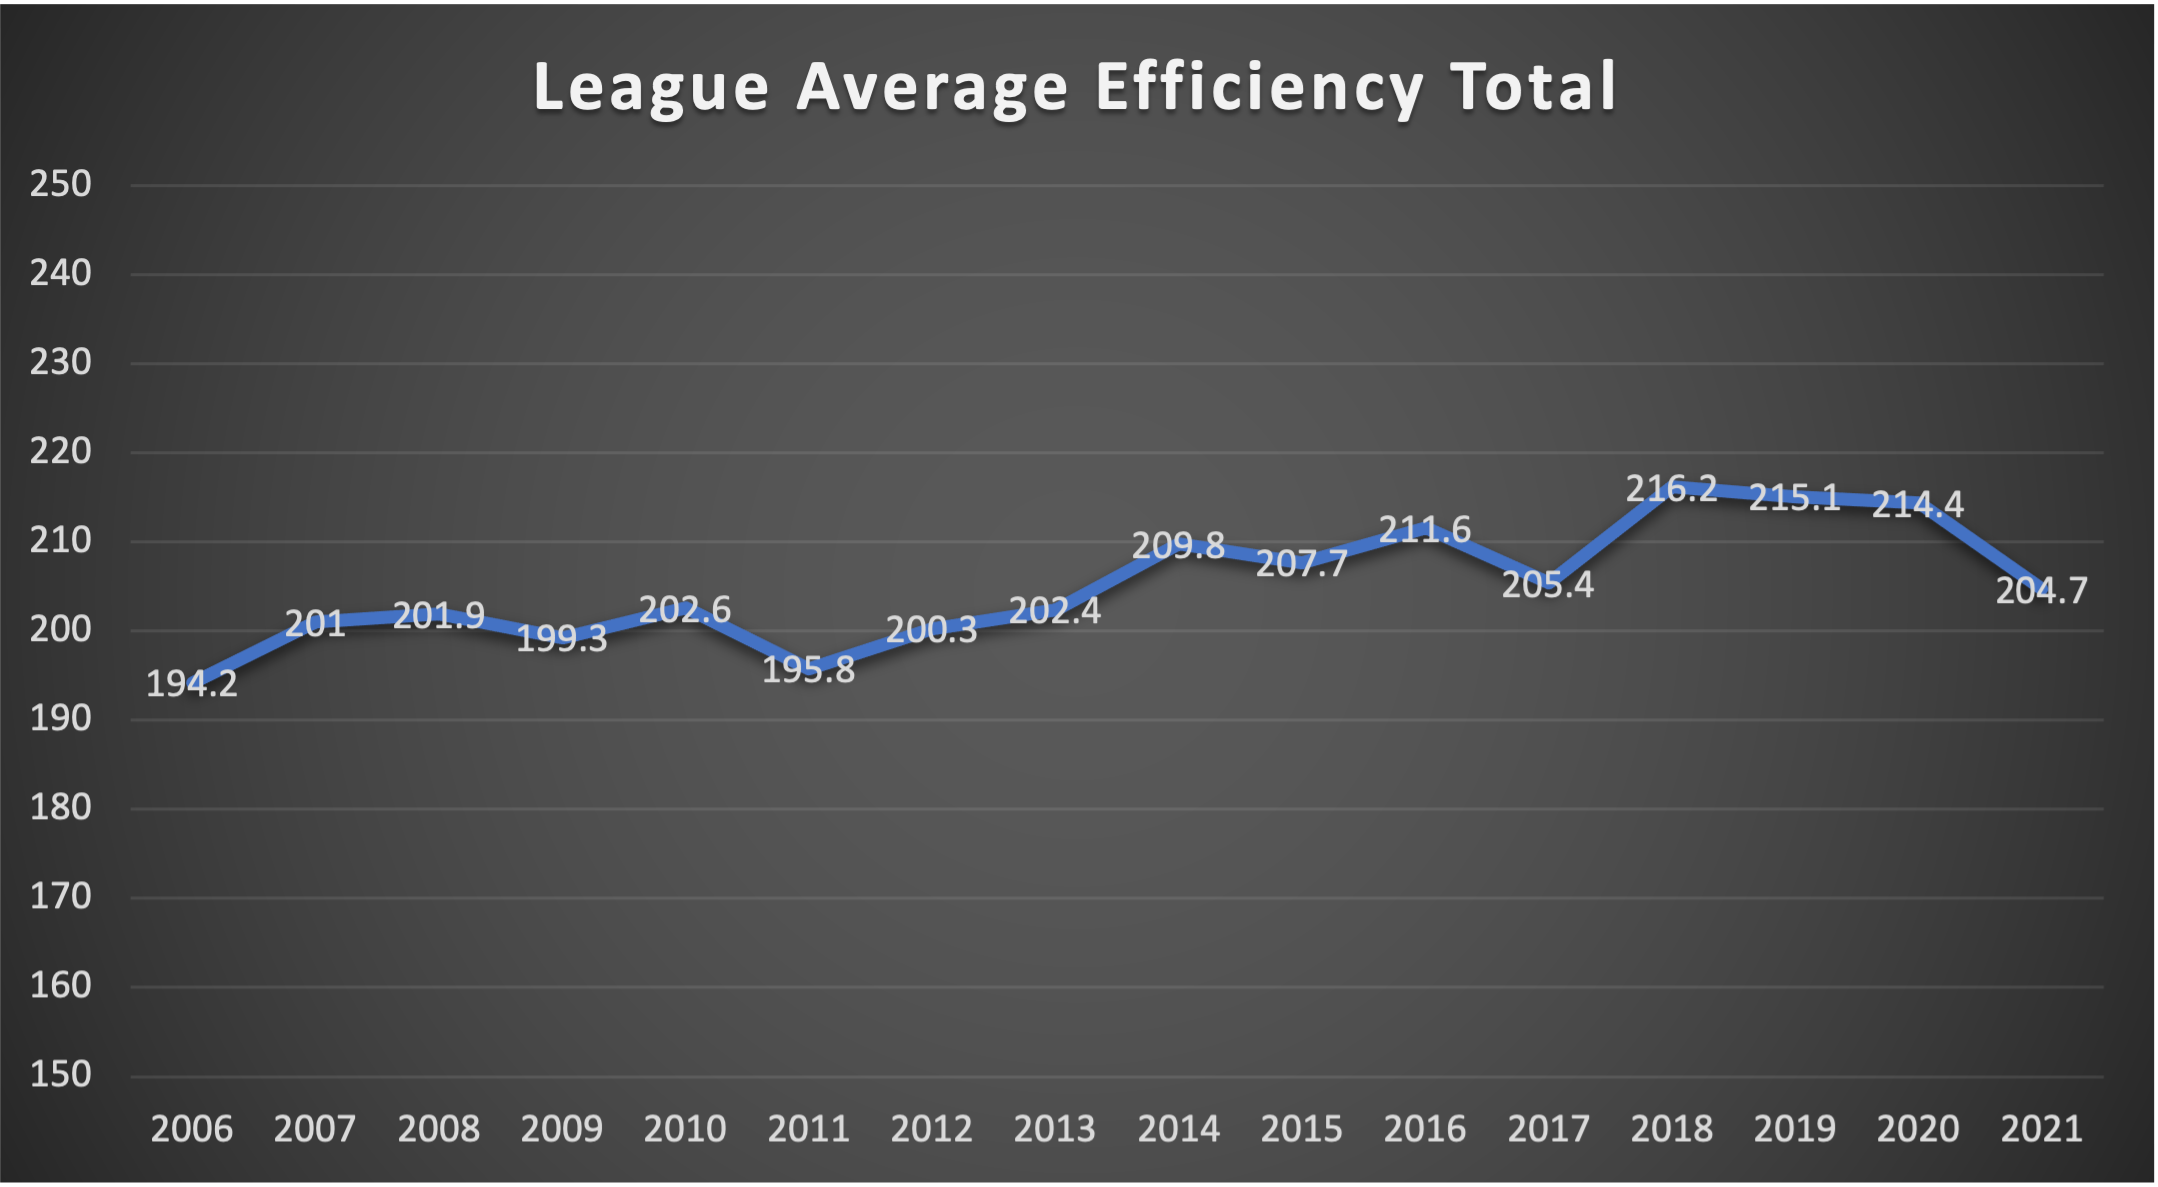
Here is a graph displaying the annual league average Efficiency Total since 2006:
This graph shows the Efficiency Total of all the quarterbacks to win MVP since 2006:
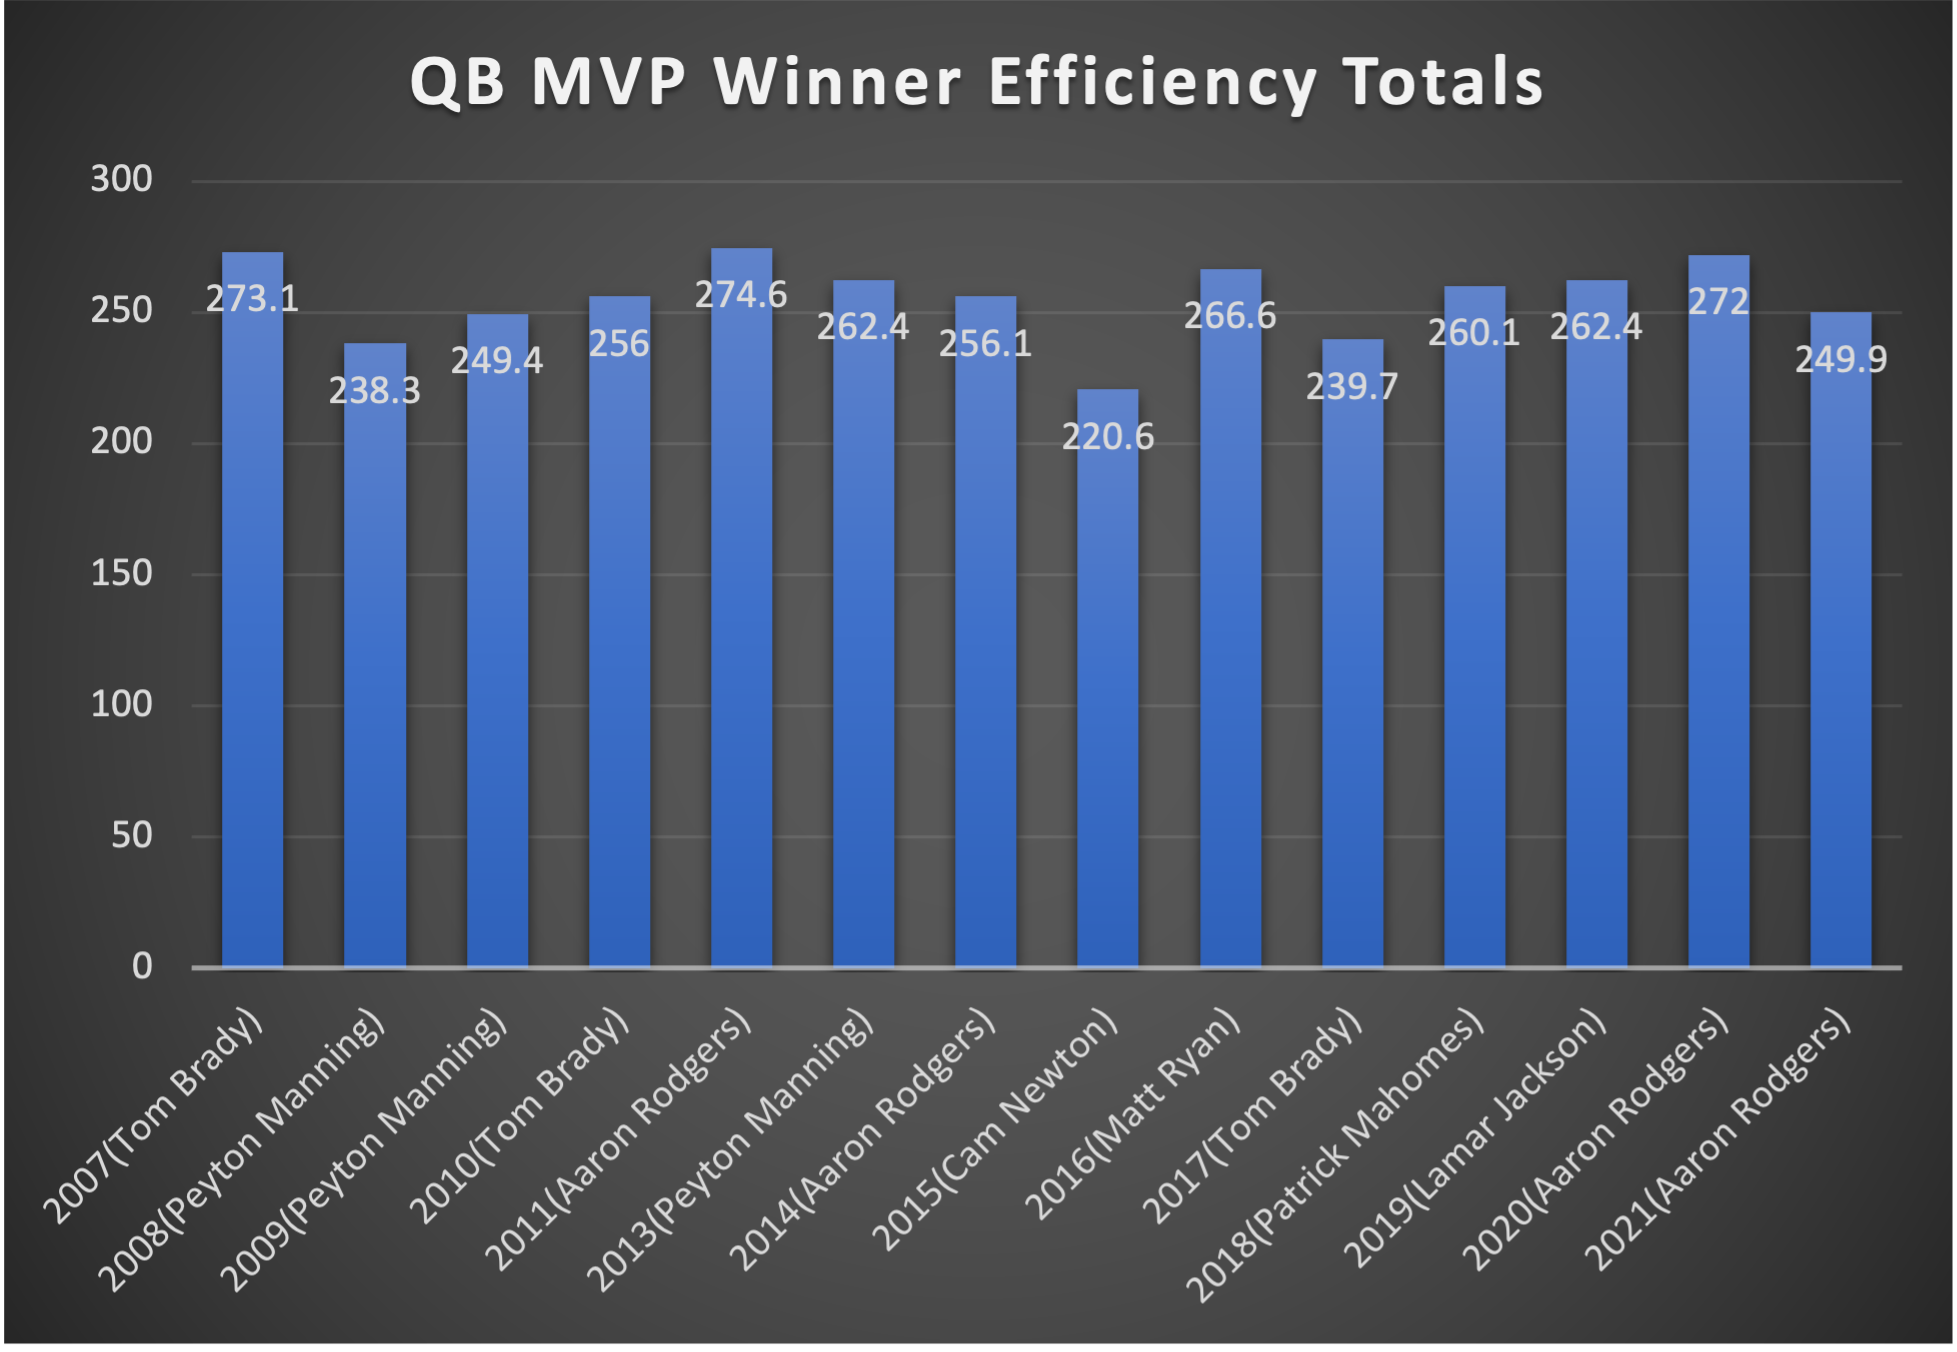
After seeing this data, it is clear that Efficiency Total is a justifiable statistic measuring how efficient/well a quarterback performed in throwing the football. Even though the MVP award technically doesn’t specifically measure efficiency, many recognize that the MVP is almost always given out to the best statistical performance of the year (usually the best performance by a QB). It’s fair to say that the player who wins MVP has to be efficient at his job, or else he wouldn’t win it. This is why I believe this statistic lends itself well to many arguments/comparisons of passers. Since 2006, 14 of the 16 MVP winners have been quarterbacks. Of those 14, seven ranked first in ET for that season. However, finishing first in a category is extremely difficult, and often the differences between players in ET is very miniscule.
An even more telling observation was that 12 of 14 QB MVP performances since 2006 ranked in the top two of ET for that season, and 13 of the 14 ranked in the top three. Cam Newton was the only one to finish outside the top five in ET (likely awarded due to his combination of rushing and passing success, though ET measures only passing success). The fact that leaders in ET were able to represent the QB MVPs so successfully shows the effectiveness of ET. Another noteworthy piece of data that I found was that the average ET of all the quarterback seasons that won MVP since 2006 was 255.8, which makes sense, as the average league leading ET was very close to that; 259.1.
League average for ET has stayed fairly consistent since 2006, which is fantastic because that allows for better comparisons between over time. It’s worth noting that the average ET has steadily risen, but not drastically. The mean of the yearly league average ETs from 2006-2021 was 205.2, which makes total sense, as 205.2 falls into the average category of ET on the chart from earlier. Players considered the best and most efficient passers since 2006 often made the top five each year. These players include current or future Hall of Famers like Drew Brees, Tom Brady, and Peyton Manning.
Another interesting observation was before calculating the ETs for these players/seasons, I went through every season since 2006 and determined, in my own personal opinion, that the two best single season passing performances were Tom Brady in 2007, and Aaron Rodgers in 2011. This was based on their overall statistics during each campaign, without knowing their ETs. After the calculation of the ETs, those ended up being the two highest single season ETs. This correlation cannot be a coincidence in my humble opinion.
Conclusion
After extensive research, I am confident in Efficiency Total as a statistic that effectively measures passing efficiency. This is a statistic that I will use in my own research regarding NFL quarterbacks, and I hope you will consider adopting this measure, too.
About the Author
Brady Goodman is a junior here at Samford University. He is a part of the sports analytics program.
Email: bgoodman@samford.edu
Twitter: b_good_8
LinkedIn