How much do fouls affect winning? This is an age-old question in all sports. Should teams play a less physically aggressive style to have a better chance of winning, or should they even consider fouls a factor? This analysis aimed to determine how much of a factor yellow cards played in pro soccer wins in leagues across the world. The study looked at the top five soccer leagues for the past decade to see if there was a negative correlation between yellow cards and wins. I ran the same correlation test in R for every season of the five leagues in the past decade to get a correlation coefficient and a P-value. This correlation coefficient conveys how much of a positive or negative correlation there is between the two chosen variables (yellow cards and wins). The size of the P-value indicates whether or not the null hypothesis can be rejected or not. A null hypothesis postulates that the two variables have no effect on each other at all. To reject the null hypothesis, we must have a P-value lower than 0.05, which is standard when testing for correlation. Each graph below represents one season for a particular league. The data points on the graphs represent the league’s teams and their placement is based on their respective number of wins and yellow cards. I will highlight every graph in red for each season with a negative correlation coefficient lower than -0.5 and a P-value smaller than 0.05 to show which seasons demonstrate a strong negative correlation between wins and yellow cards. With that information in mind, let’s dive into the results of the tests.
Germany Bundesliga
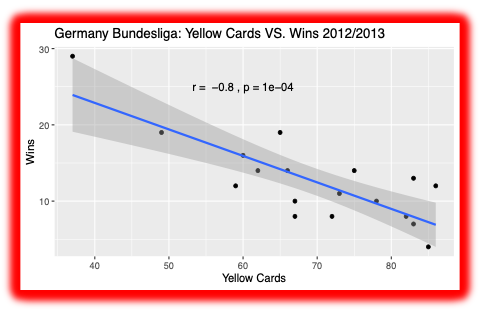
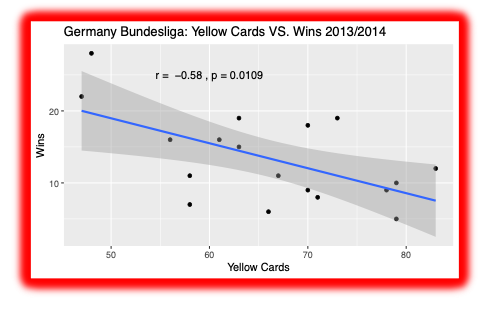
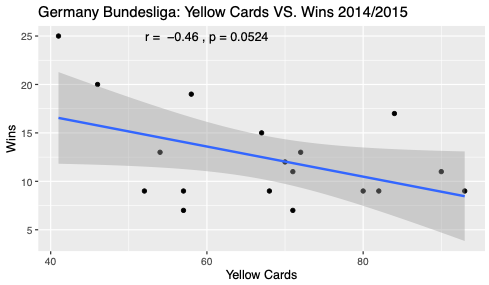
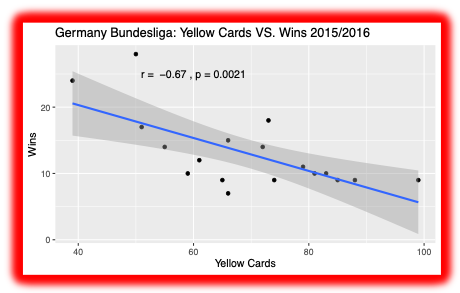
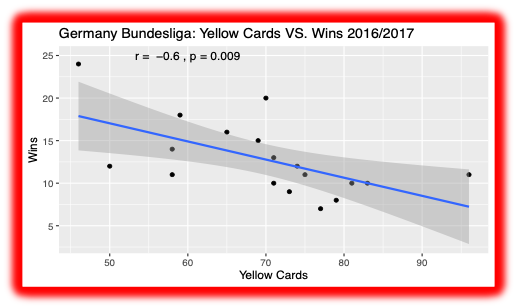
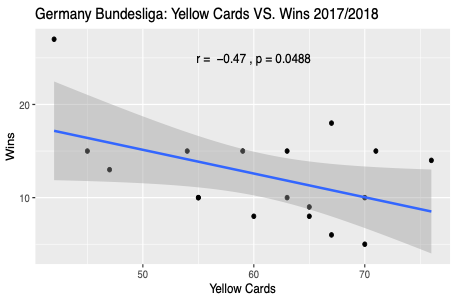
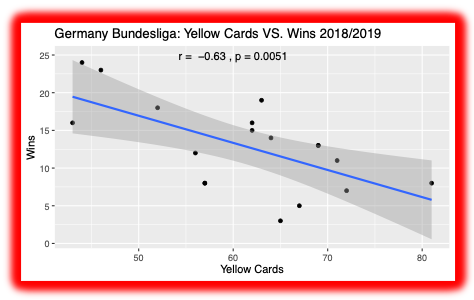
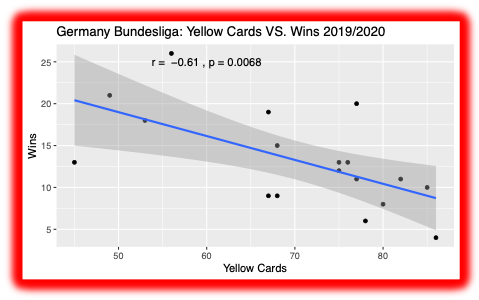
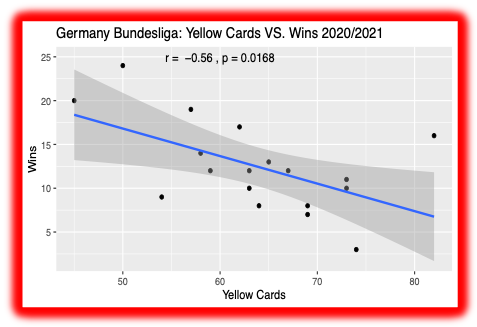
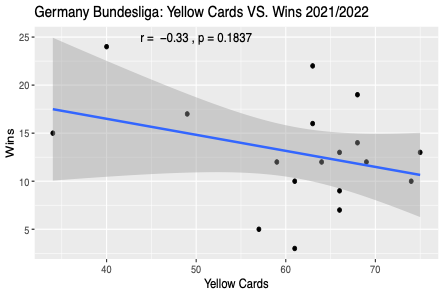
From the results of my testing, I saw that the Germany Bundesliga had a total of seven out of the ten seasons that showed both a decently strong negative correlation coefficient and a P-value less than 0.05. However, their last season showed the weakest of all correlations of the past decade despite the previous three seasons showing signs of correlations. The fact that seven out of the ten seasons display a robust negative correlation suggests yellow cards as being an important factor in determining if a team will lose or not in the Bundesliga.
EFL
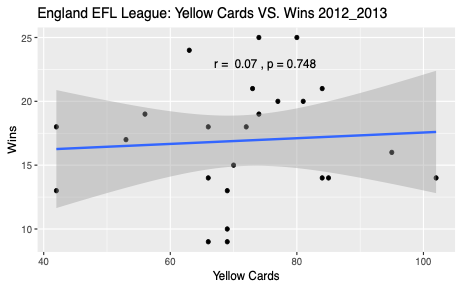
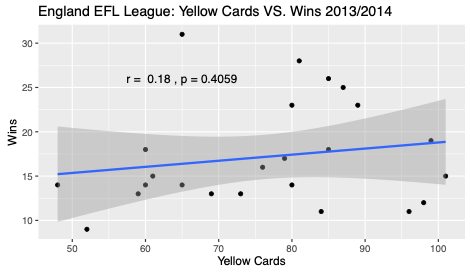
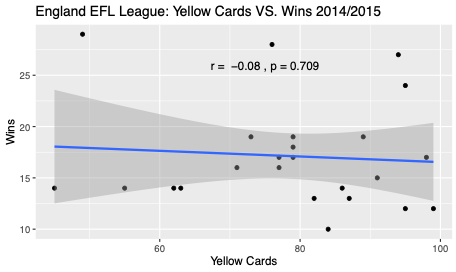
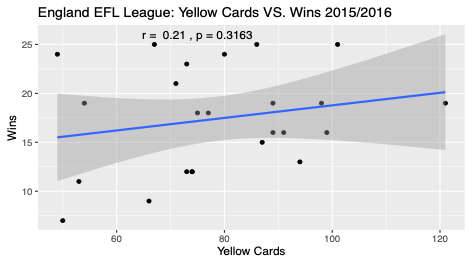
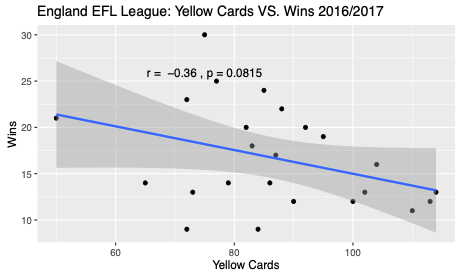
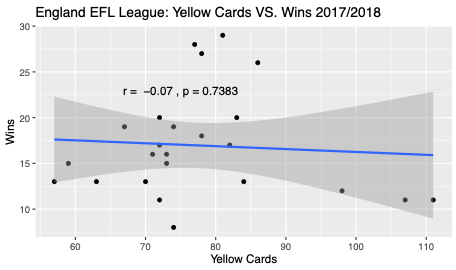
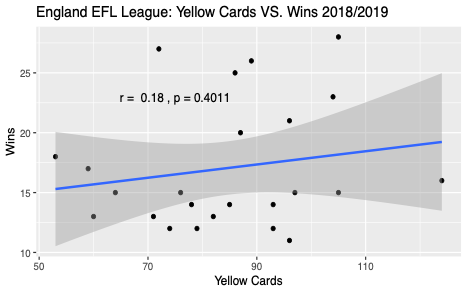
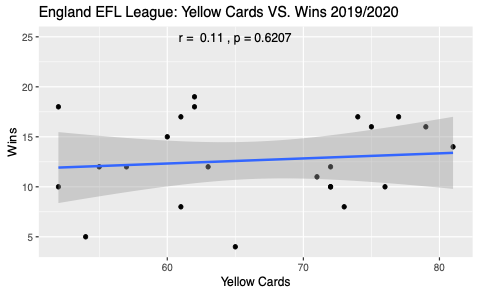
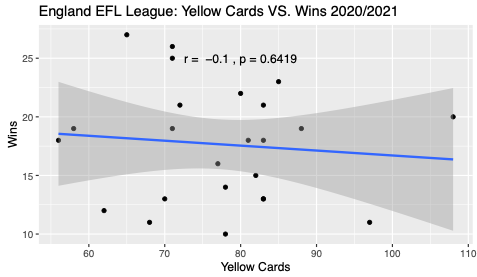
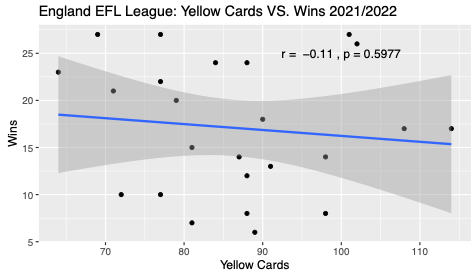
In contrast to the Germany Bundesliga data, there wasn’t a single season in the English Football League (EFL) that showed a strong negative correlation between yellow cards and wins. Instead, there was a positive correlation between the two variables on multiple graphs. The graphs that had a positive correlation however did not have a correlation coefficient of over 0.5 or a P value less than 0.05, which means that the results do not prove any significant positive correlation between the two variables either. The main takeaway from our results from the EFL is that yellow cards have had little to no impact on winning in the past decade.
EPL
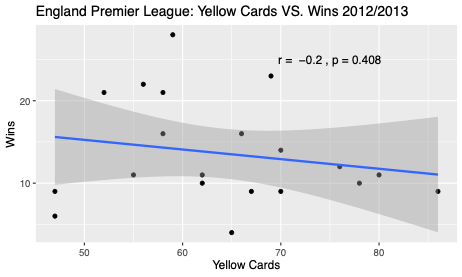
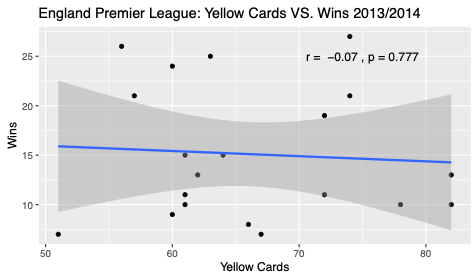
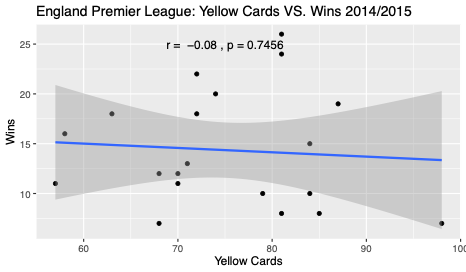
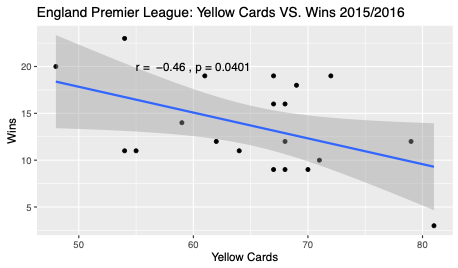
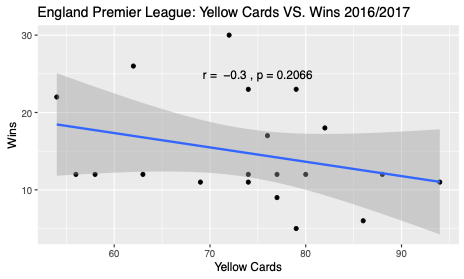
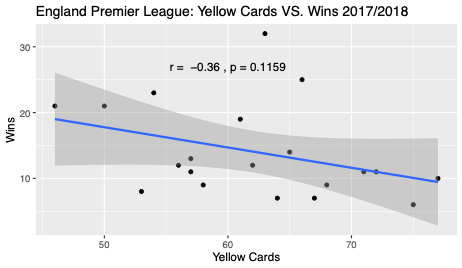
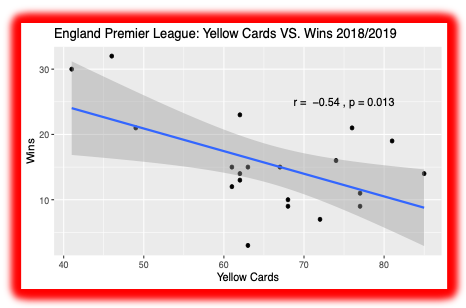
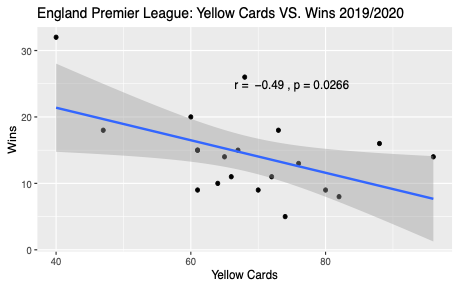
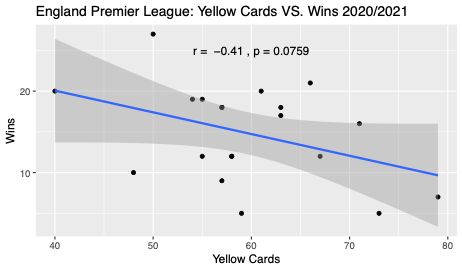
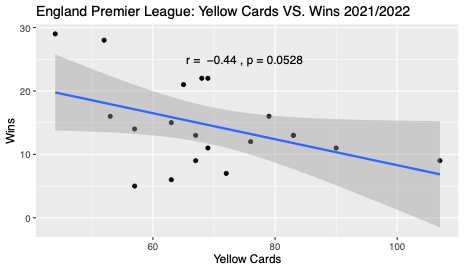
The England Premier League (EPL) results didn’t show the strongest negative correlation but did show more than the EFL. Only one season met the standards to show a strong negative correlation with a correlation coefficient of -0.54 and a P-value of 0.013 in the 2018/2019 season. Two other seasons met the P-value qualifications but didn’t have a strong enough correlation coefficient to match the qualifications for a strong negative correlation. All the seasons showed a negative correlation, but not rising to a level of significance. This is different from what was observed in the EFL, where no consistent relationship was demonstrated. However, the results were not strong enough to show that yellow cards have a significant impact on winning in the EPL, with only one season out of ten showing a strong negative correlation.
La Liga
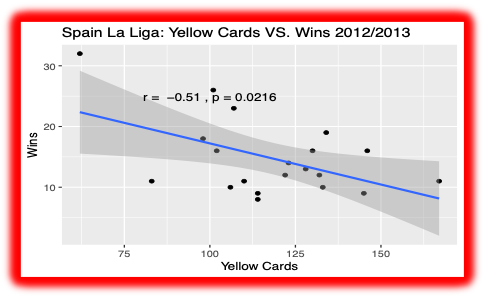
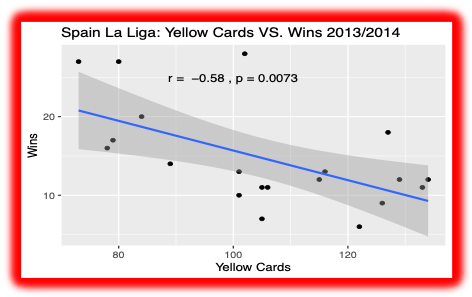
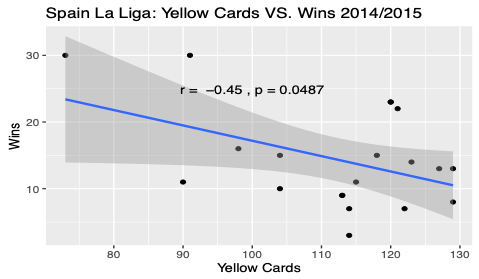
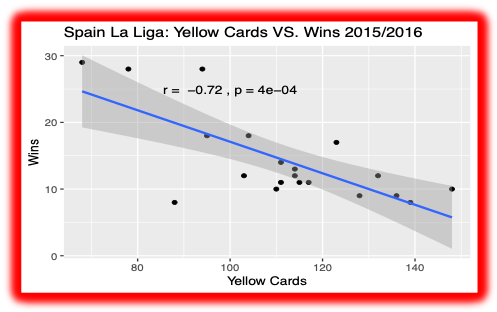
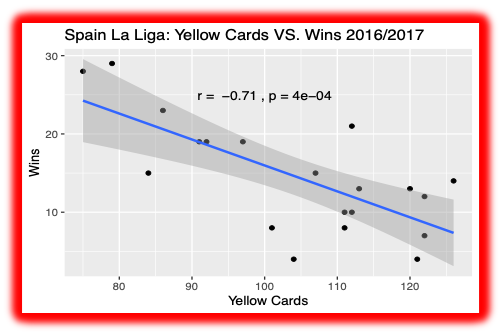
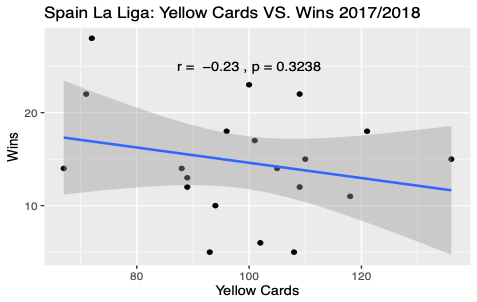
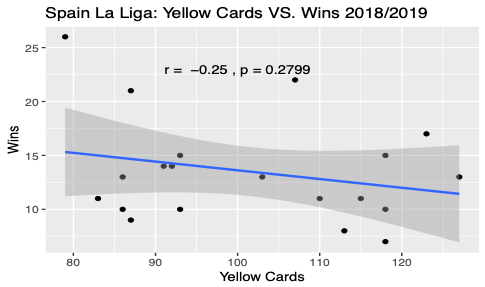
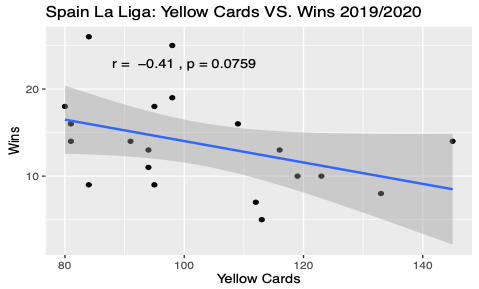
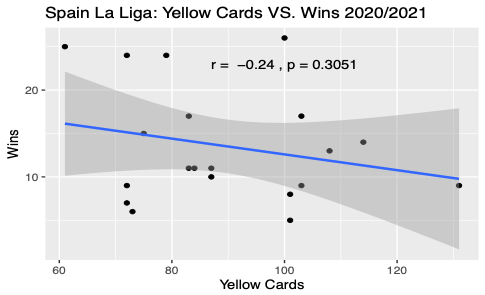
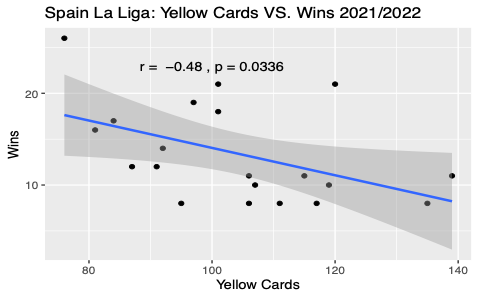
La Liga showed a decently high number of strong negative correlation seasons, with four out of ten seasons meeting the qualifications for the strong negative correlation. Two other seasons are on the verge of meeting the qualifications for a strong negative correlation. The qualifications for a strong negative correlation for those two seasons were partially met, with P-values under .05 in seasons 2014/2015 and 2021/2022. The only qualification that wasn’t met was the correlation coefficient with correlation coefficients of -0.45 and -0.48. If these two seasons had a slightly stronger negative correlation, six out of the ten seasons would show a strong negative correlation rather than four. Again, there was a negative relationship slope in each of the seasons for this league, indicating that fouls do play a factor in winning in La Liga, but only meeting significance criteria in four of the ten seasons.
Serie A
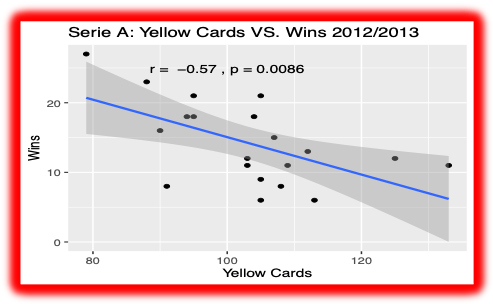
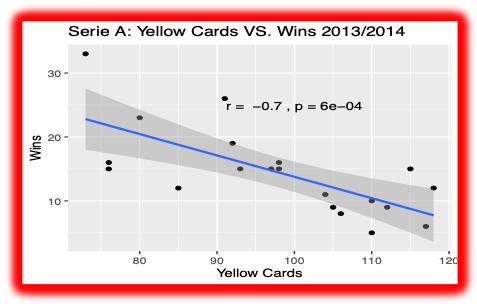
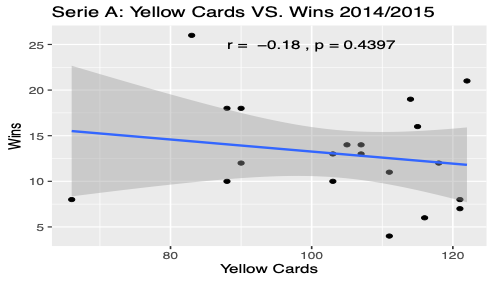
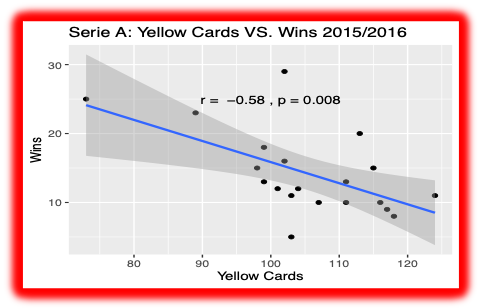
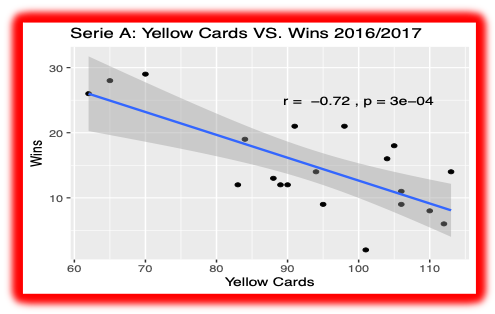
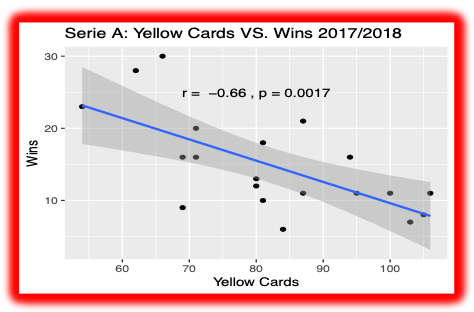
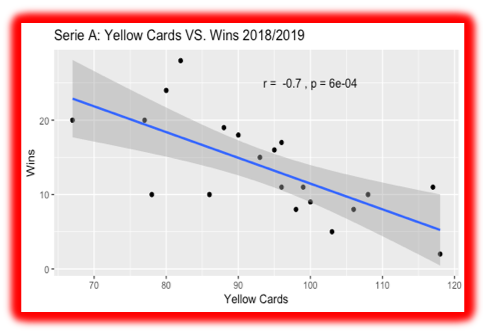
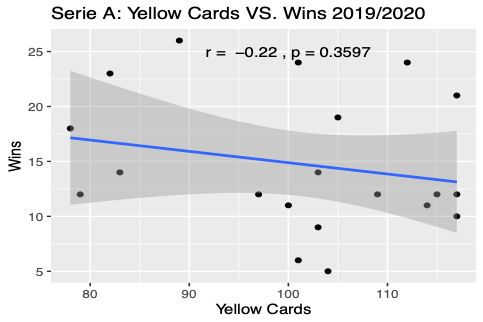
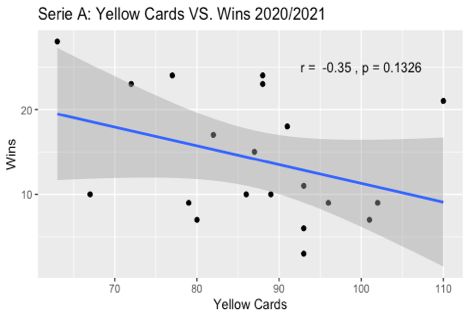
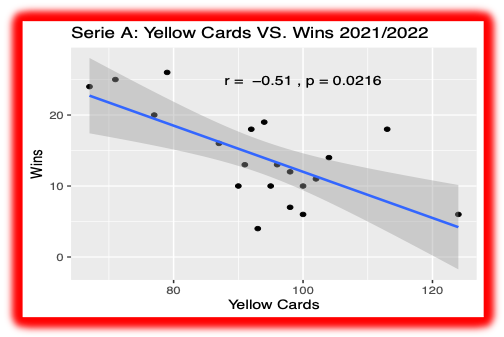
The last league I looked at was Serie A. Serie A is tied for the most seasons showing a strong negative correlation, with seven out of the ten seasons showing a significant correlation. Despite two of the final three seasons not showing a strong negative correlation, that trend ended with the 2021/2022 season. The qualifications for the 2021/2022 season were met, demonstrating a strong negative correlation between yellow cards and wins, with a correlation coefficient of -0.51 and a P-value of 0.0216. Overall this league had a majority of seasons from the past decade showing a strong negative correlation, so more yellow cards could definitely be considered a strong factor in fewer wins in Serie A.
Conclusion
Going into my research, I expected to see a strong negative correlation between yellow cards and winning in almost all leagues. I am surprised that only two of the five leagues showed a majority of seasons over the past decade that had a strong negative correlation between wins and yellow cards. The Bundesliga and Serie A were the only two leagues to have a majority of the seasons, showing my predicted strong negative correlation. La Liga didn’t quite have the majority of seasons showing strong negative correlations but was close, with four out of the ten seasons showing a strong negative correlation. What was most surprising to me was the EFL and the EPL. Combined, the leagues only showed one season of strong negative correlation. Yellow cards have little to no effect in either of these leagues in wins. I don’t know why this is, but it could be the different skill levels of teams. By this, I mean that the teams receiving the yellow cards are good enough to beat their opponent regardless. This would invalidate the theory that yellow cards cause teams to have fewer wins. This may not be the actual reason, but with further research, one could uncover why yellow cards have less of an impact in games. There are some leagues where more yellow cards cause less winning, and the next step is figuring out why this varies so much in leagues.