
To download the Relegation Prediction Model click this LINK
To watch an instruction video on how to use the Relegation Prediction Model click this LINK
The Premier League provides quite the spectacle season in and season out. Aside from the memorable on-field moments, the battle on the table heightens the drama in each and every matchweek. Not only does the title race provide the excitement in the league, but so does the race to avoid relegation at the bottom of the league. The fight towards retention provides tense matchups particularly towards the end of the season, and this year’s iteration of the relegation battle was no different. The tussle for safety was decided on the very last day of the season, with Leeds United and Burnley tied on points for the final relegation spot going into their respective last matches. Both matches lived up to the tension and dramatic consequences of the relegation race, with Leeds United scoring a 94th minute winner to secure the escape from being demoted to the Championship, handing the ultimate spot to Burnley, who lost their respective match.
In the age of analytics, making predictions using recorded data and trends have become more accessible and efficient. The use of big data has allowed for models to be generated and trained to analyze and predict future occurrences. This article looks into how predictive analytics can be utilized to forecast teams to be relegated by the end of the season using both data from previous seasons as well as from the current season. In this exercise, team results from the three previous seasons (2018-19 to 2020-21) were used as training data to optimize the model that was used in predicting the relegated teams of the 2021-22 season.
Correlation: Determining Possible Predictors
The first step in developing the model was determining factors that could potentially accurately predict the teams to be relegated in the current season. For this, a correlation matrix was generated to visualize the relationships among the different factors made available by the data from the past three seasons.
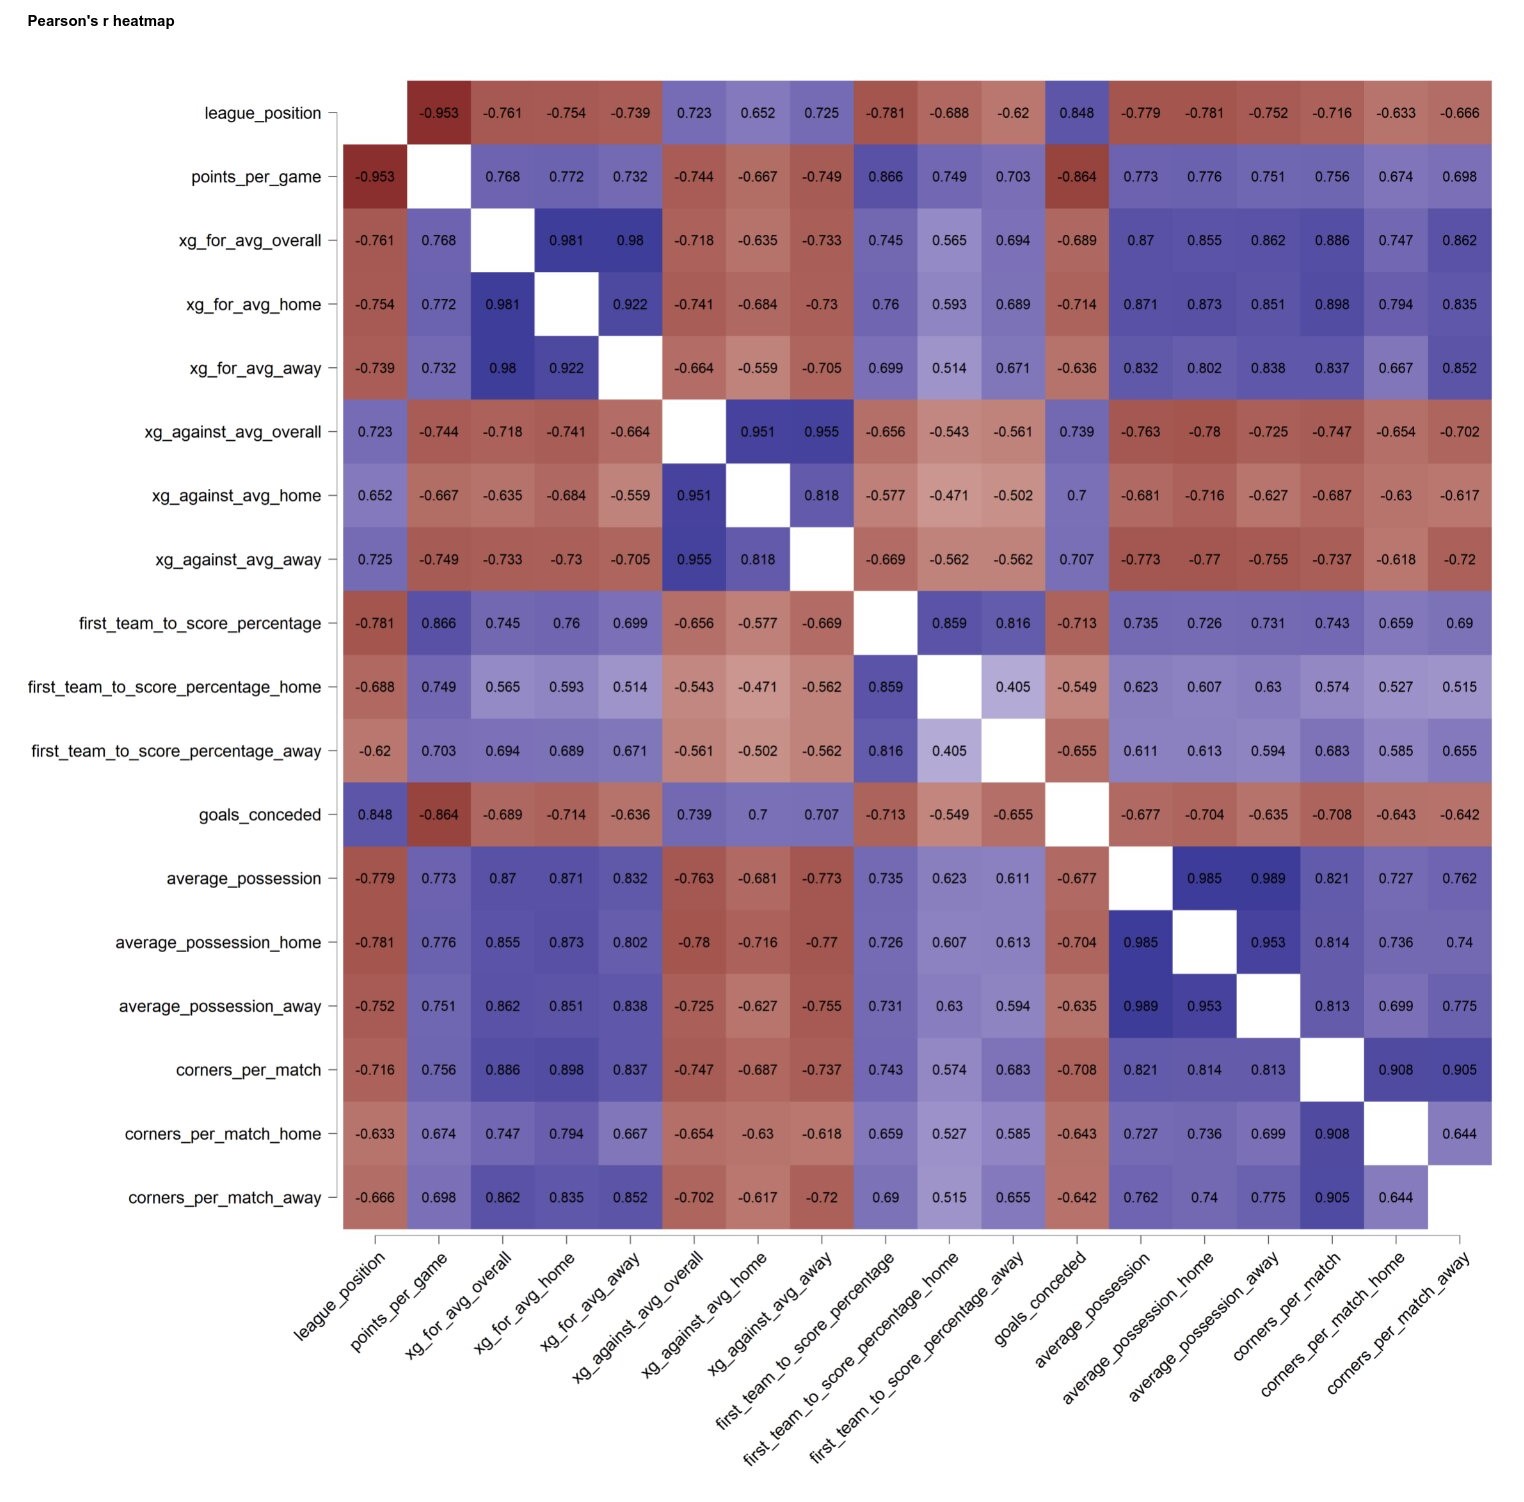
The matrix displays respective Pearson r correlation coefficients between two metrics in the data. A perfect -1 coefficient indicates that an absolute negative correlation is present between the two variables (as one increases, the other decreases, vice versa), while a perfect 1 coefficient signifies an absolute positive correlation (as one increases, the other increases). A perfect 0 coefficient shows that there is no correlation between the two variables. Significant relationships between points per match and average possession, percentage in the first team to score in a match, and average xG against the team were found in the matrix. The latter three variables were then used as predictors with points per match being the variable to be predicted.
The Predictors
Average Possession
The percentage of the match that a team possesses the ball on average comprises the first predictor. Said variable has a 0.773 r value with points per match, which means that the more a team possesses the ball in a match, the more likely that team is able to bring home points from the match. Teams who tend to have less possession, then, are those that sit at the bottom of the table and are in the relegation battle with the least points in the league.
First Team To Score Percentage
The following predictor exhibits the percentage of matches in a season that the team was able to break the deadlock and open the scoring in a match. The relationship that this predictor had with points per match is at 0.866, showing strong correlation between the two. The data then show that teams are unlikely to win more points when conceding the first goal of the match, thus leading to more draws or losses.
Average xG Against
The expected goals (xG) metric measures the likelihood of a scoring chance to be a goal, calculating and providing a score from 0 to 1 for every shot. The model behind the metric considers numerous variables such as shot distance, goalkeeper positioning, angle from goal, and many more for maximum accuracy; using thousands of hours of video as bases to train the model. The metric used as the predictor in this exercise counts the expected goals that a team’s opponent has against them on a per-match average basis. The relationship between this metric and points per match is at -0.744, exhibiting a strong negative correlation. This means that the more quality opportunities an opponent has against a team, the less favorable the match result would be for the latter with less points to bring home.
Regression: Generating The Predictive Model
After determining possible predictor variables, a multiple regression model was generated with points per match as the dependent variable. A multiple regression model takes recorded data and fits a model using the identified variables to output a certain predicted value. For this exercise, the identified variables are the predictors mentioned above, while the predicted values are the points per match forecasted for each team. The model had the following characteristics.
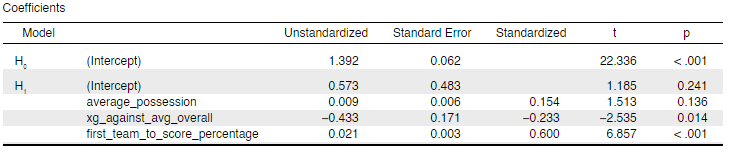
The “Unstandardized” column shows the coefficients that would be multiplied to each variable, the sum of which will result in a team’s points per match as predicted by the model. The “p” column also shows the p-values of each variable, which exhibit how probable a variable is in significantly affecting the prediction. The lower the p-value, the more probable it is in being a significant predictor in the model. With the variables having relatively strong p-values, being able to score first proves to be the most significant predictor in forecasting a team’s points per match output, based on the numbers from the previous three seasons.
Prediction Results
The results of the regression model can be found below, with a comparison to the actual relegation battle that occurred during the 2021-22 season.
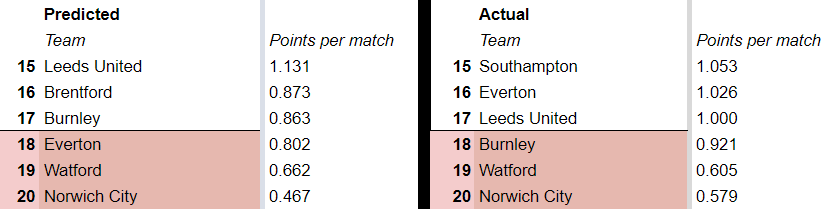
As seen in the results, the model was able to predict the two lowest-placed teams that were relegated: Norwich City and Watford. The model also correctly predicted five teams in the bottom six. However, the model did not accurately predict the last relegation spot, handing it to Everton instead of Burnley. Despite this error, the accuracy in being able to forecast the two bottom teams, as well as those involved in the relegation battle all season long, is commendable for the regression model. Using only the teams’ average possession, average xG against, and percentage of matches scoring first, the model was able to predict the relegation battle of the 2021-22 season with much effectiveness.
Predictive Model for Future Use
After finding the results of the model to be positive, a new predictive model was developed for future use, most ideally for the forthcoming 2022-23 Premier League season. Data from the 2021-22 season is included, together with the data from the past three seasons, in generating the new multiple regression model. The new model, then, has four seasons worth of data as basis instead of three. The characteristics of the new model can be found below.
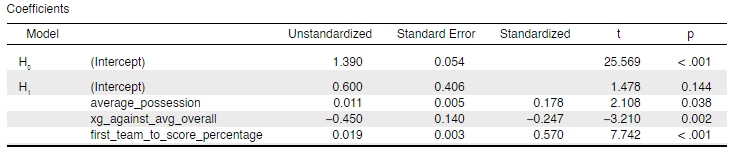
The user can input the individual teams’ average possession per match, average xG against per match, and percentage of matches scoring first to discover the model’s points per match prediction for each respective team. With more data points to base the predictions off of, and with p-values of the predictors being more significant, optimism is high for the new model to be more accurate and effective in forecasting the relegated teams of the upcoming season compared to the previous regression model.
Citation
Haworth A. (2011). [Turf Moor]. Flickr. https://www.flickr.com/photos/adamhaworth/5398692739/in/photostream/
Licensing attribution:
Adam Haworth, CC BY 2.0 <https://creativecommons.org/licenses/by/2.0>, via Flickr