
Data and analytics have continued to permeate sports everywhere, and the biggest sport in the world is no exception. Soccer teams, players, and journalists have been increasing their use of data analytics in the sport, none more apparent than in the modeling and use of expected goals.
The expected goals (xG) metric measures the likelihood of a scoring chance to be a goal, calculating and providing a score from 0 to 1 for every shot. The model behind the metric considers numerous variables such as shot distance, goalkeeper positioning, angle from goal, and many more for maximum accuracy; using thousands of hours of video as bases to train the model. The origins of xG are unclear with the term itself and the most fundamental version of the model coming from varying sources, but developments and increasing use show the metric’s influence in the sport. This influence is particularly visible as xG is at the forefront of insights when exploring the data of the USL Championship.
The USL Championship (USL) is the second-tier soccer league in the United States, placing it under Major League Soccer (MLS) in the US soccer hierarchy. The league consists of two conferences with 14 teams each, holding conference double-round-robin regular season games and one-off knockout playoffs to determine the league champion. Data were collected from USL teams across the past three seasons with metrics (e.g. win percentage, goals, corners, possession, xG) analyzed for any correlation, particularly to assess if any determine team success.
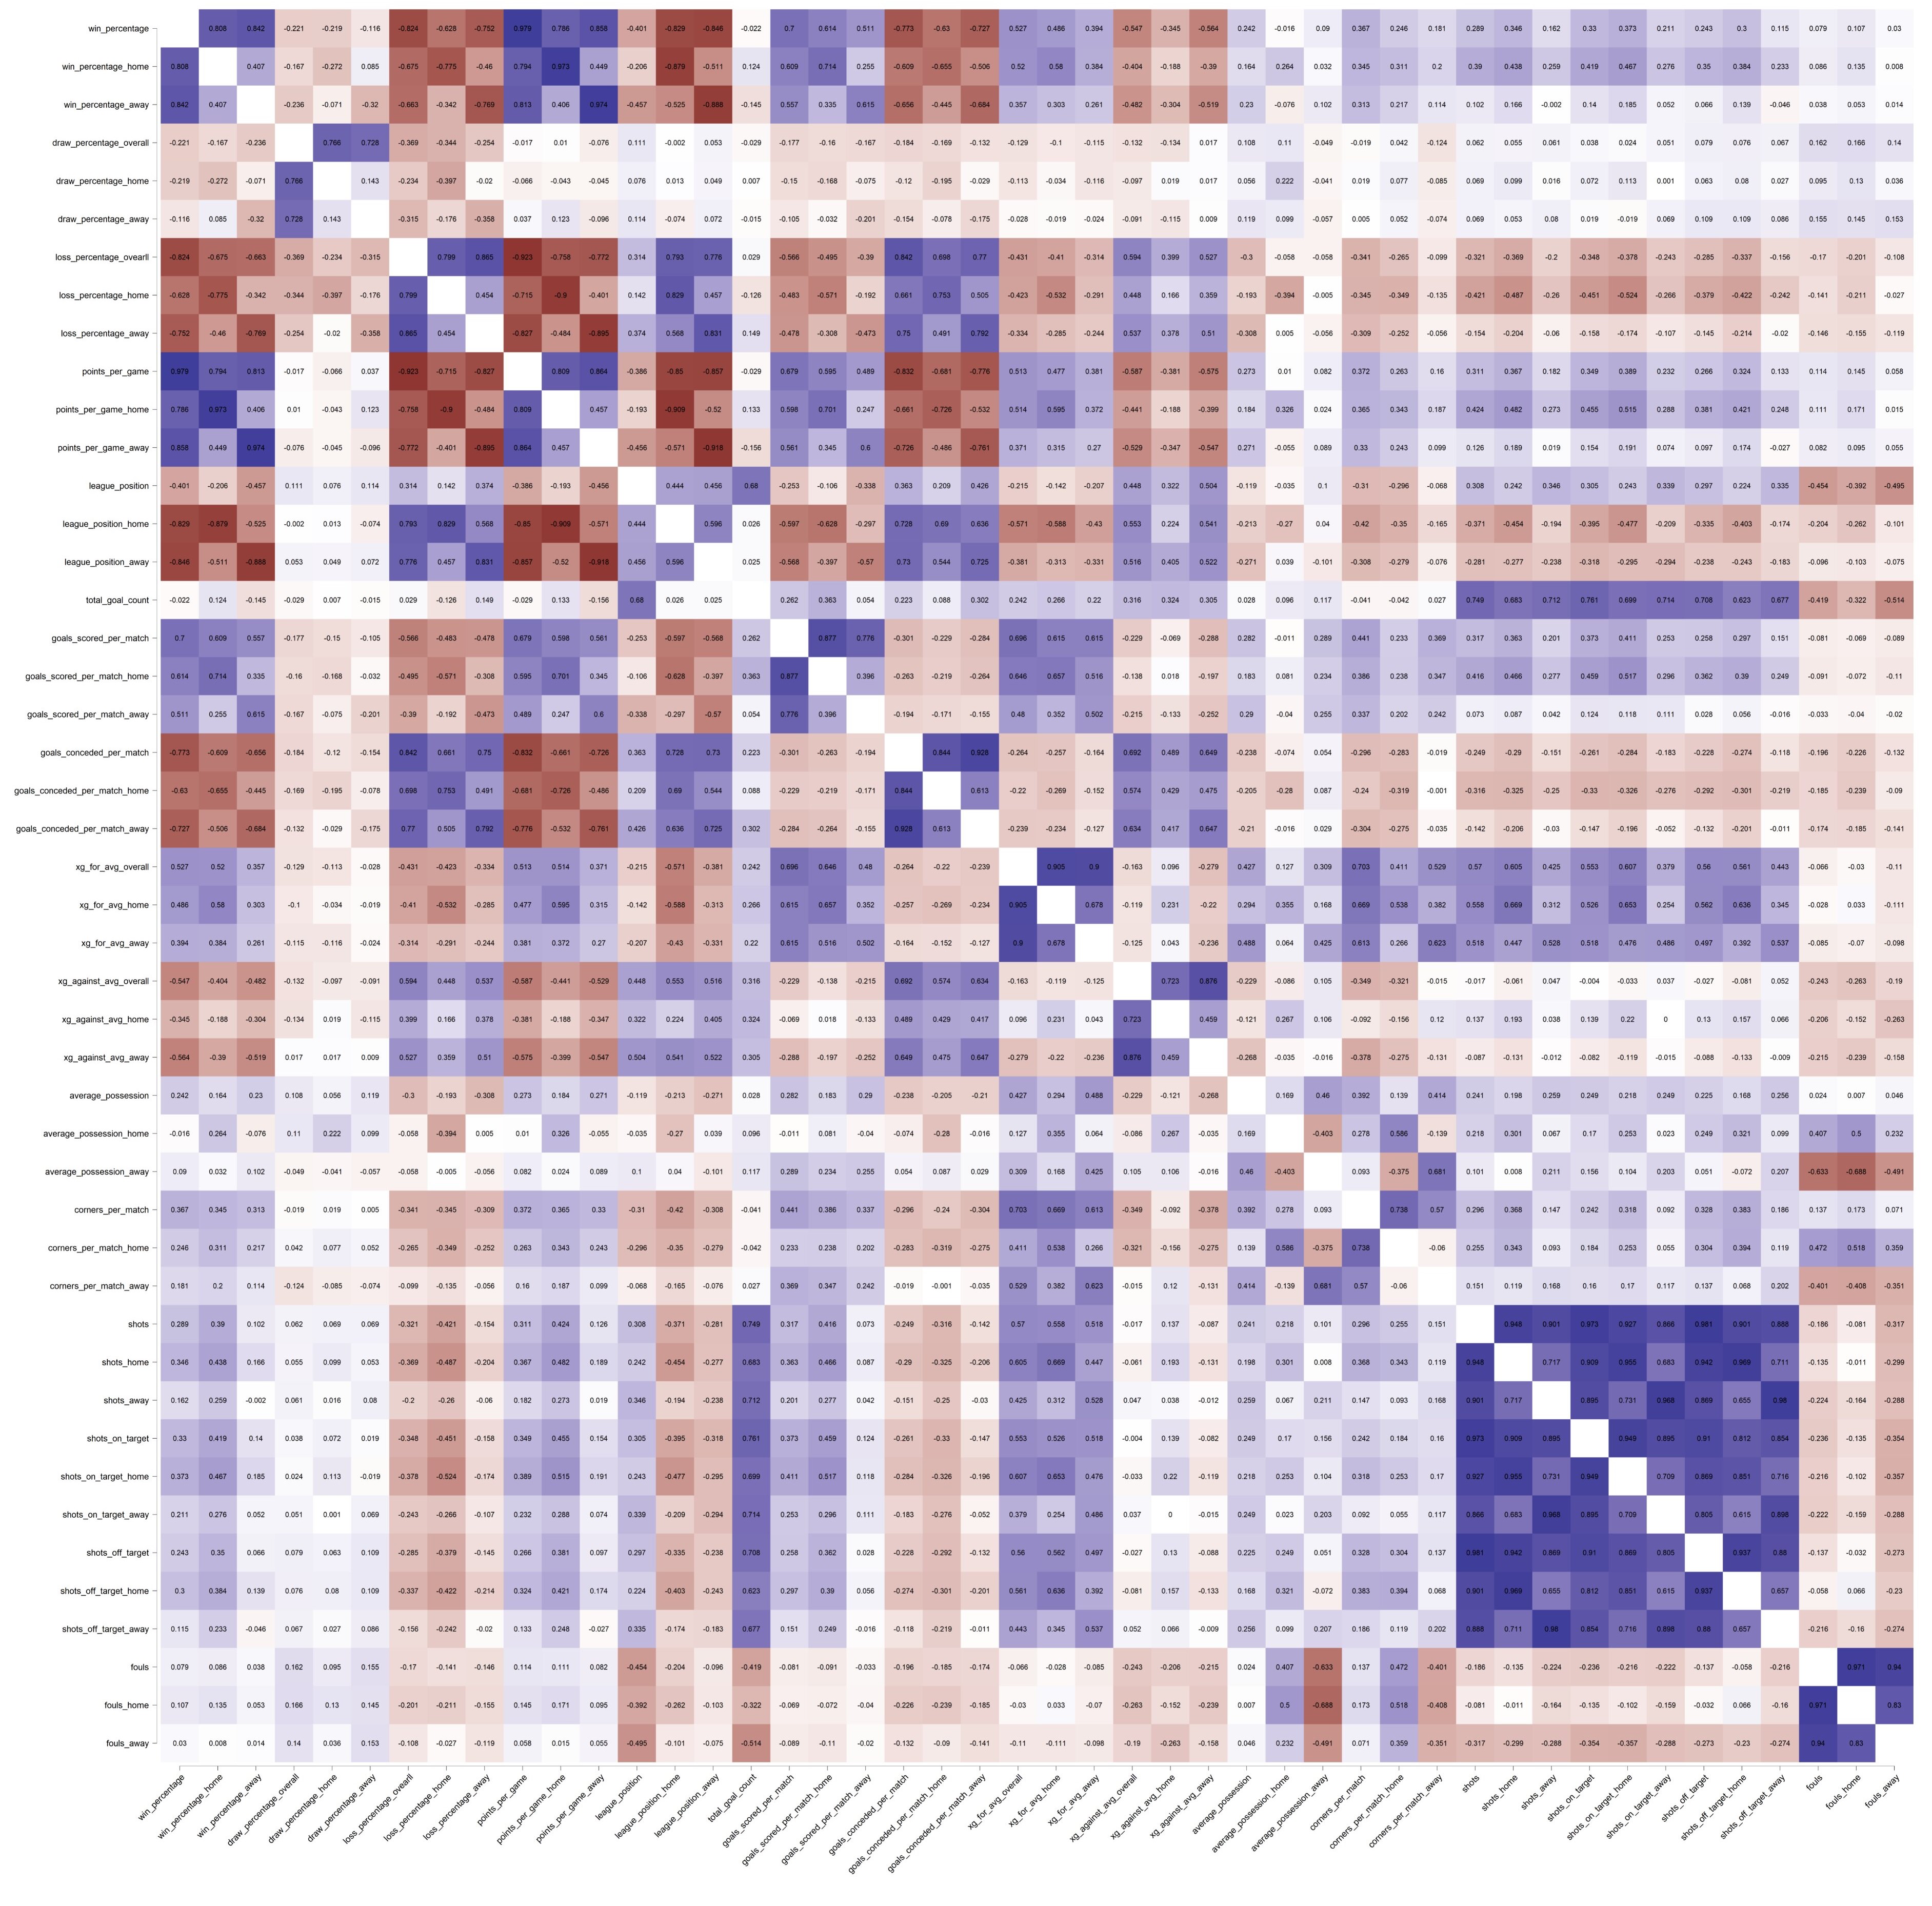
The matrix displays respective Pearson r correlation coefficients between two metrics in the data. A perfect -1 coefficient indicates that an absolute negative correlation is present between the two variables (as one increases, the other decreases, vice versa), while a perfect 1 coefficient signifies an absolute positive correlation (as one increases, the other increases). A perfect 0 coefficient shows that there is no correlation between the two variables. Among the findings from the correlation matrix shown above, insightful relationships on xG can be found, particularly its significant correlations with corners and win percentage.
xG and Corners: Set Piece Leading to Quality Shots?
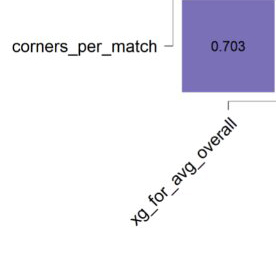
As seen in the figure, the correlation coefficient between team corners per match and team xG per match is 0.703, which can be interpreted as a strong positive correlation between the two measures since the coefficient is close to 1. This relationship is more apparent in the plot of average team corners and xG per match below.
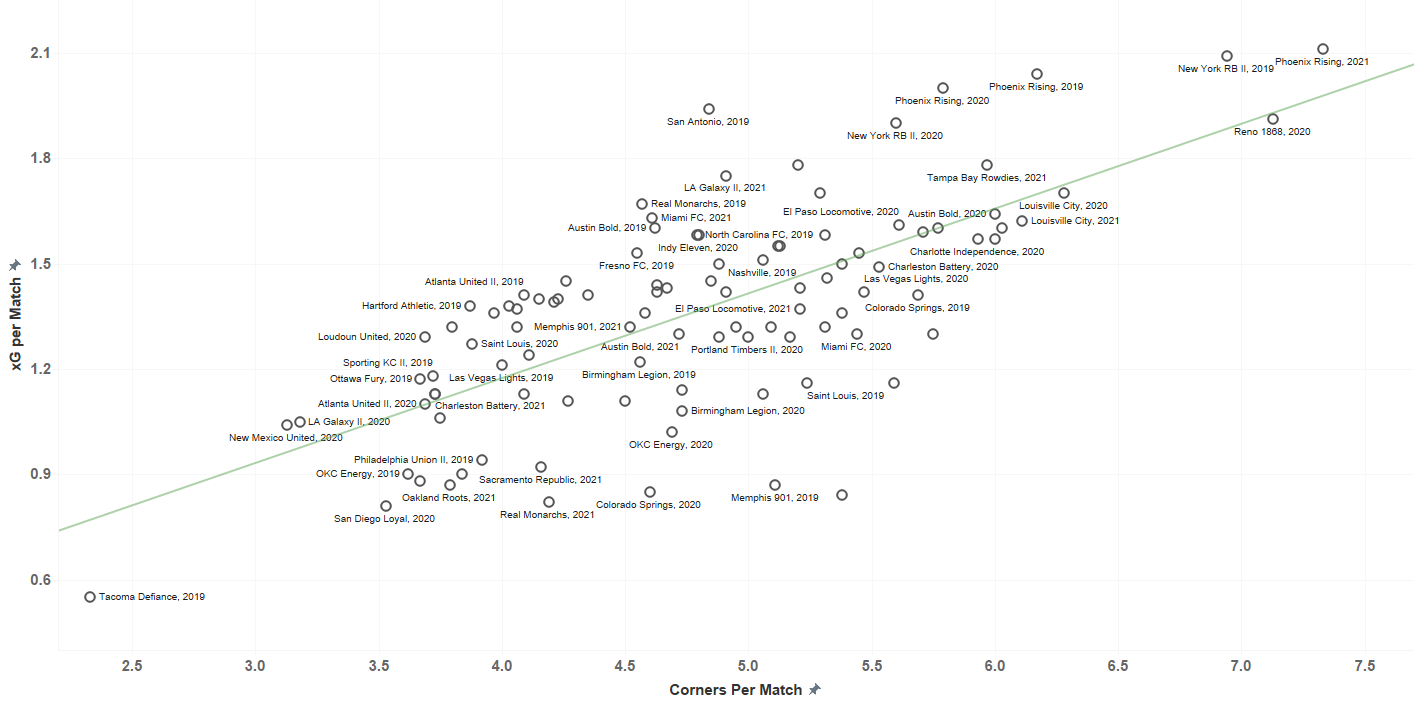
As visible in the plot and noted by the green trendline, there is an upward trend between corners and xG. As teams have more corner kicks per match, more often than not, they also have more expected goals per match. This possibly indicates that the more a team takes corners in a match, the more quality shots it has in said match. It could also be interpreted as corner kicks being a prime producer of shots with high probabilities of scoring, particularly in the USL. Team staff and players can utilize this information by possibly putting more emphasis on drawing corners, thus increasing the amount of expected goals for the team.
xG and Win Percentage: Good Shots, the Key to Success
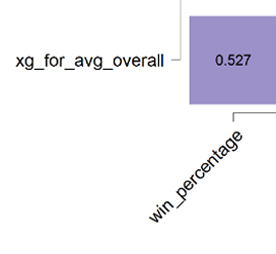
Albeit not as strong as the previous pair, xG and win percentage also have a positive correlation at 0.527. A plot of average team xG and win percentage can also be seen below to further visualize this relationship.
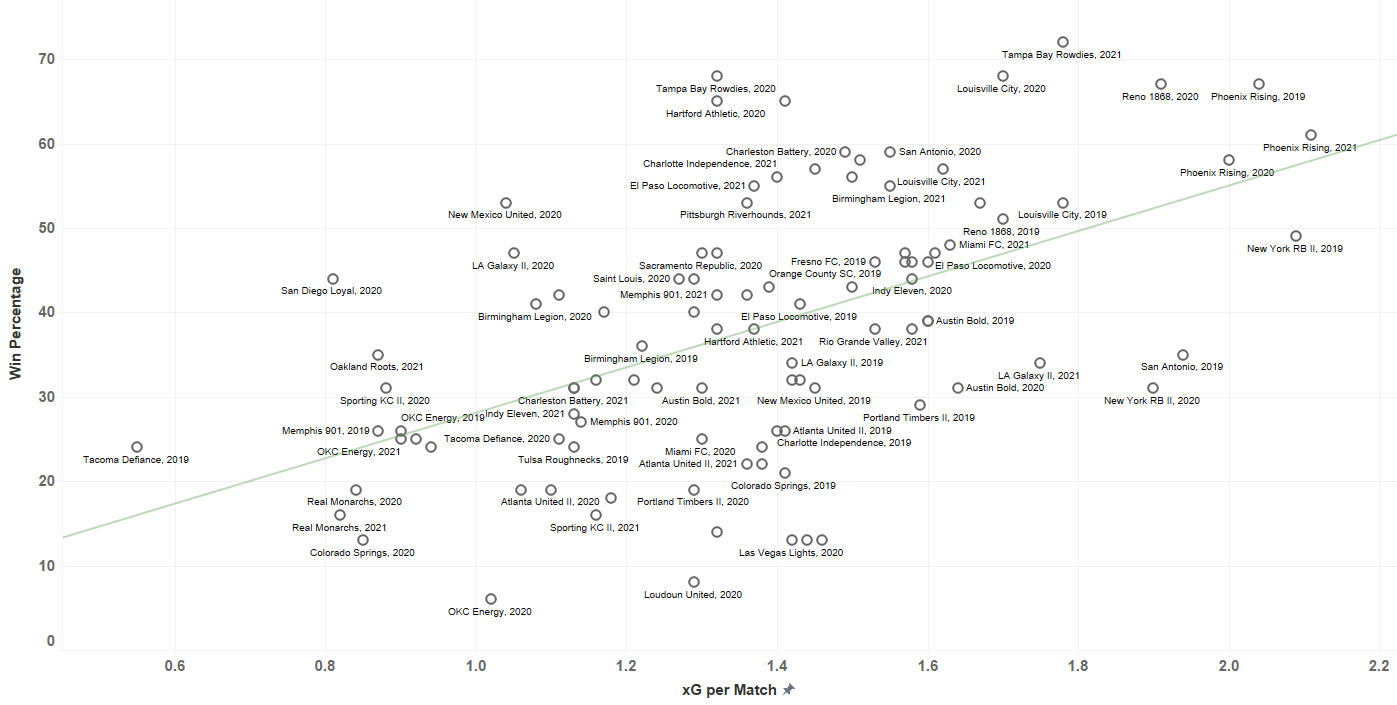
It may not be as tight as that of corners and xG, a generally upward trend is still apparent between the two metrics. And although it goes almost without saying, the correlation confirms that taking quality shots does lead to team success. Teams can then more authentically rely on the xG model to analyze individual shots and matches, maximizing analytics to optimize player and team performance.
Expected goals can be a powerful tool if appreciated well and used effectively in the context of team success. Particularly for teams in the USL, teams can aim to raise shot quality using xG leading to wins, and increasing chances from corner kicks may be one of the primary ways to achieve this in the league. With further utilization and analysis of the xG model, more game-changing connections and insights can be made that can ultimately lead to a championship-winning formula.
Citation
Schiff H. (2018). [Champions celebration by FC Cincinnati in winning the 2018 USL Regular Season Championship]. Wikimedia Commons. https://upload.wikimedia.org/wikipedia/commons/4/4d/CINvIND_2018-09-29_-_champions_celebration_%2843368258090%29.jpg
Licensing attribution:
Hayden Schiff from Cincinnati, USA, CC BY 2.0 <https://creativecommons.org/licenses/by/2.0>, via Wikimedia Commons
###
Author Bio
Carlo San Agustin is a Filipino college senior majoring in Management Engineering and minoring in Data Science and Analytics in Ateneo de Manila University, one of the top institutions in the Philippines. He has previously worked for a semi-professional basketball team in the Philippines as graphic designer and social media manager, but now aims to fully focus on Sports Analytics, particularly Analytics in Player and Game Performance. He possesses academic experience in Python, SQL, Tableau, AWS, and JASP.