
The 2022 NFL season officially concluded last Sunday with the Kansas City Chiefs’ 38-35 win over the Philadelphia Eagles, for Patrick Mahomes and the Chiefs’ second Super Bowl win in four years. The game was arguably an all timer as Harrison Butker’s kick with seven seconds put Kansas City on top for good. But that’s not what I’m here to talk about.
I am proud to present, for the first time, my attempt at an NFL Predictive Model this year. This model was created using a linear regression on all basic statistics for NFL games from 2010-2021 to first find which statistics were deemed significant and thus warranted inclusion in this model. From there, I used the corresponding coefficients for each of the 4 statistics that the regression labeled significant. This gave me a basic score predictor and calculation, but the hard part was still yet to come: Game Simulation
The Structure for Success
The game simulation model was very simplistic because it was my first time modeling the NFL. We calculated each teams Expected Passing Yards, Rushing Yards, Giveaways and Takeaways based on the formula shown below:
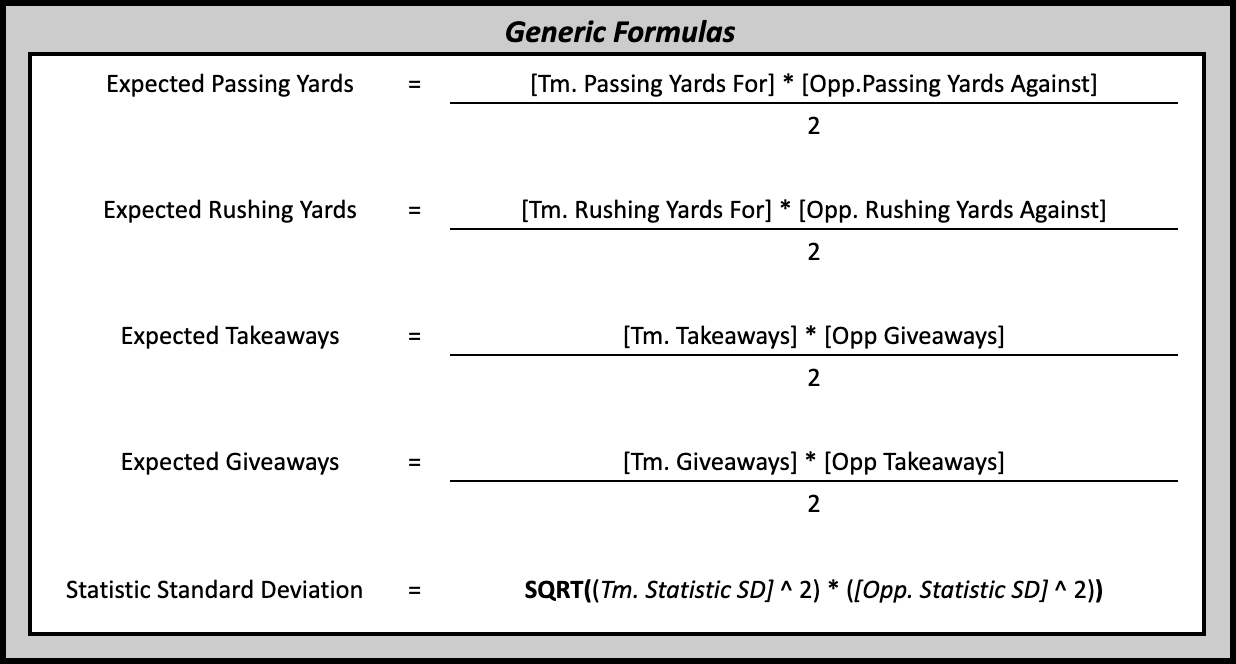
These values are then used with a randomly generated number from 0-1 and the NORM.INV() function in excel with the standard deviation to produce the specific game’s respective stat for each team. After calculating the expected value of each statistic, I then multiplied each predicted stat by the point value that the linear regression previously gave. This produces a single-game result. By repeating this process 10,000 times and adding a little bit of Secret Streitmatter Sauce, we can simulate 10,000 games between any two teams to find our predicted result.
The Model in Action
Let’s take the 2022 AFC Championship game as an example. In that game, the Kansas City Chiefs hosted the Cincinnati Bengals in Arrowhead Stadium. Our model first gathered each team’s Passing Yards For/Against, Rushing Yards For/Against, Takeaways and Giveaways and created our expected values based on the formulas shown above:
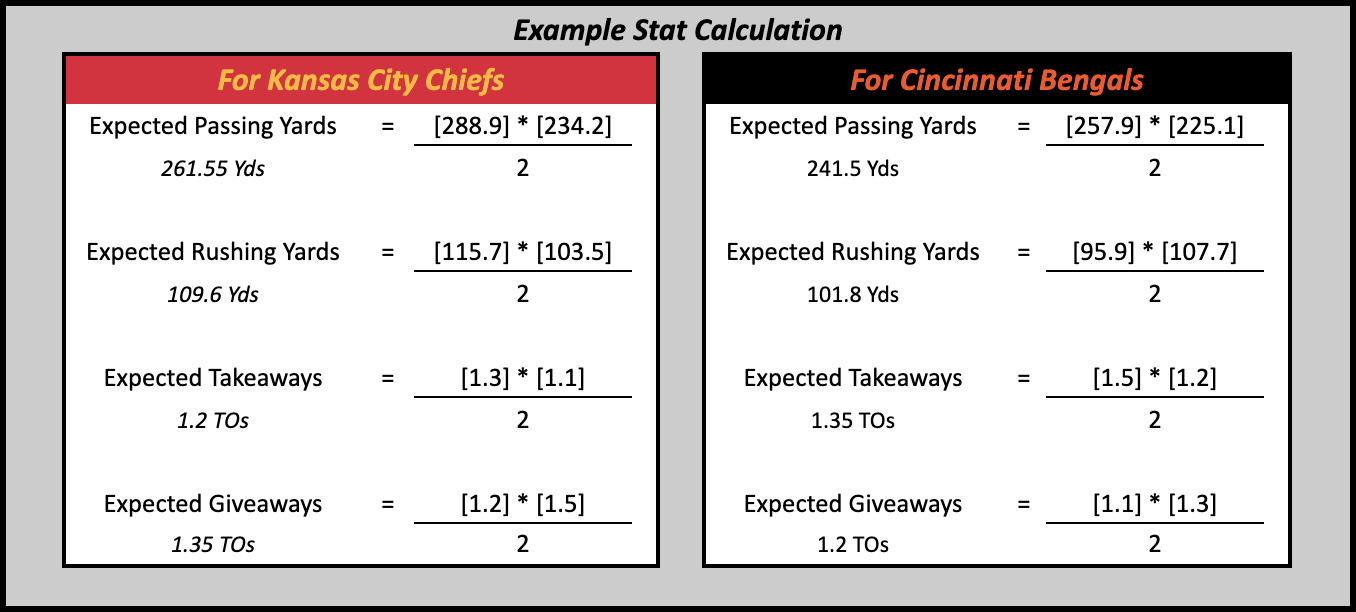
For one game, we may have a random probability of .25 for the home team and we assume then .75 for the away team. Using this logic, we would find the point on our normal distribution curve for all four Kansas City Stats where 25% of the area is to the left. This returns an expected Passing Yards of 220.41. (For a more in depth explanation of value generation)
Over the course of the 2022 NFL Season, the model predicted every game from Week 4 to the Super Bowl. Additionally, I bet a theoretical $10 on every game based on what the model suggested and the closing line on Fanduel Sportsbook. I began the season with one model (V1) and, after Week 8, made a slight tweak (V2) to the model to try and improve accuracy.
Let’s Talk Outcomes
Both models were above 60% and profitable, but our second version was highly successful. From week 8 to the Super Bowl (excluding week 18), the model predicted a 70.7% success rate. When looking at a potential competitor for a predictive model over the same period of time, I compared the model to 538’s Elo predictor. 538’s Elo projections were at a 65.43% success rate which was 5% worse than mine.
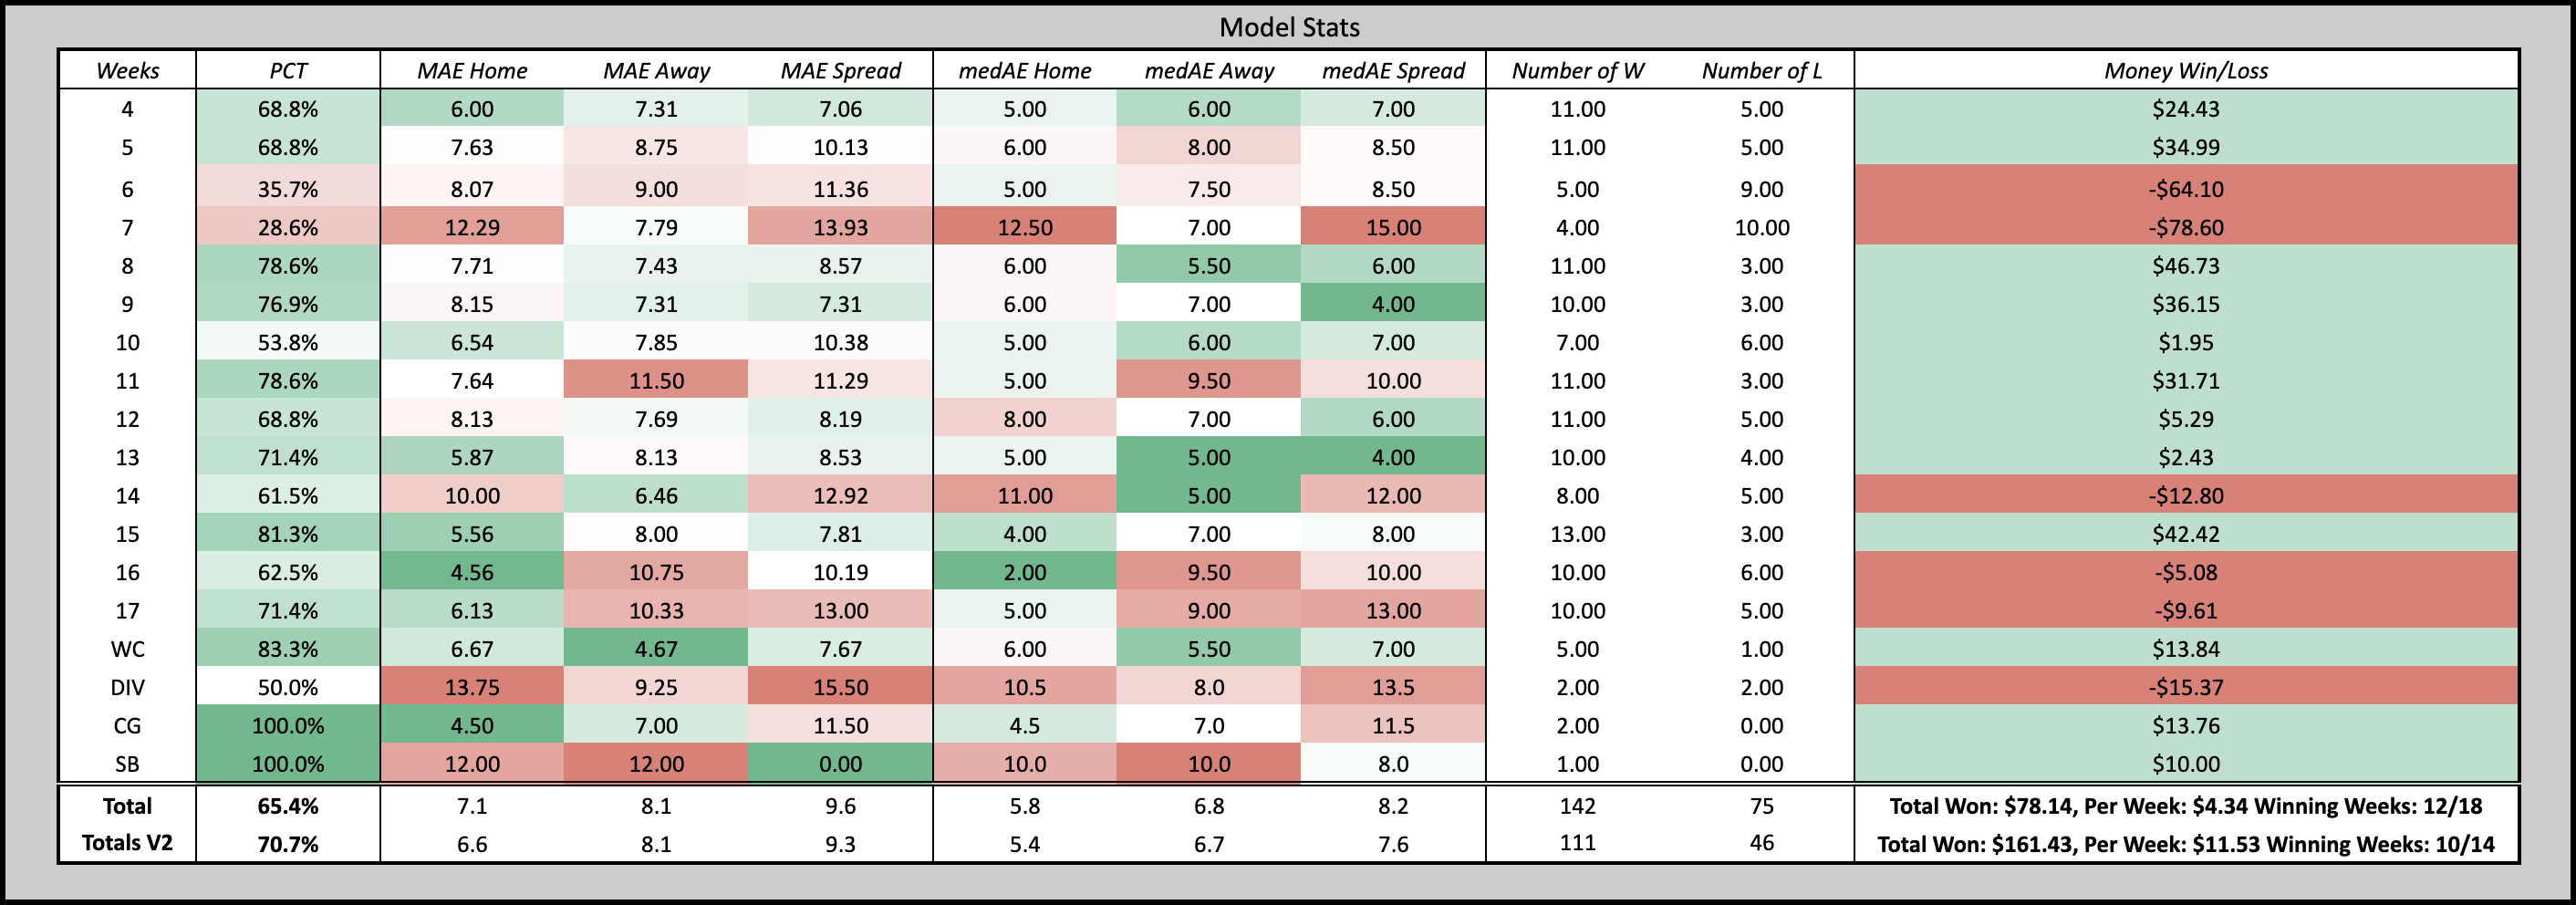
Looking at it from our betting perspective, I invested a total of 1,570 theoretical dollars into our games and ended the season with $1,731.43, equating to a return rate of 10.28%. While I don’t encourage taking out all of your investments and betting them on NFL games, if you invested that same $1,570 into the S&P 500 on October 30th (the start of Week 8) and withdrew it on the Monday after the Super Bowl, you would have $1,677.46 which is a return rate of only 6.84%. On average, we returned $11.53 for each week that we bet, the equivalent of one entire bet investment
The 2nd goal of this project was to build coding skills and create an easily replicable application. This project started as a heap of VLOOKUP, AVERAGE functions with countless referenced cells but ultimately ended up as an R Shiny Web Application with the help of the legendary Tommy Fowler. The link to the application (frozen in time forever as the 2022 season) is linked below if you would like to see how badly your favorite team would beat their rival or how close your team is to exiting the tanking stage and moving into the competitor stage.
Resources
Boice, J., & Boycoffe, A. (2023, February 13). Can you beat Fivethirtyeight's NFL forecasts? FiveThirtyEight. Retrieved February 16, 2023, from https://projects.fivethirtyeight.com/2022-nfl-forecasting-game/results/
Curiel, A., [HenceTheBoom]. (2023, September). No Title. TowardsDataScience. https://towardsdatascience.com/improving-a-famous-nfl-prediction-model-1295a7022859
CVIAXMIWNPTR. (2023). NFL Team Stats 2002 - Feb. 2023 (ESPN). Kaggle. https://www.kaggle.com/datasets/cviaxmiwnptr/nfl-team-stats-20022019-espn