.JPG)
- Overarching Question
In this project, we seek to answer the question, 'can we evaluate if a player is performing as expected based on physical metrics and combine testing?' This project aims to give an overall rating to both offensive linemen and pass rushers on pass attempts, then comparing this to how they are expected to perform based on combine metrics, physical traits, and averages from previous in-game play. The combine data used is thanks to Pro Football Reference and NFL Combine Results.
- Creating a 'Success Rating'
First, we needed to create a comprehensive success rating for both offensive lineman and pass rushers. These players are not awarded individual EPAs like quarterbacks, so we emulated a similar statistic. We referred to an article by “The 33rd Team” to create this value. We ran linear regression models to see how a player’s in-game stats correlated to the team's EPA while he was on the field. This left us with these equations:
- Offense: - (Total Wins Allowed X 0.305) - (Total Sacks Allowed X 0.2) - (Total Hits Allowed X 0.4) - (Total Hurries Allowed X 0.095)
- Defense: (Total Sacks X 0.6) + (Total Hits X 0.2667) + (Total Hurries X 0.1333)
Then, we divided those values by a player's total number of plays in order to average out the statistic revealing the actual success rating. Since the offense statistics all decrease a players' success rating, 0 is the best success rating a player on the offensive line can receive. This is different from the defense where 0 is the worst success rating a player can receive.
- Finding Double Team Rates (BPR & RPB)
Next, we wanted to look at how often a player was double teamed or took part in a double team block. We found the number of times a pass rusher's name was mentioned in the PFF Scouting Data provided and divided that by the number of plays they were involved in. If a player was mentioned 50 times yet only played in 25 plays, he would have a Blockers per Rusher (BPR) of 2. We applied the same logic to offensive linemen by summing up the number of plays that lineman was involved in and the number of times the player he was blocking was mentioned within the same play. Accordingly, we named this statistic Rushers per Blocker (RPB).
- Accounting for Changes in Speed
After a great talk with Alex Stern, we realized that using the 40-yard dash in our model isn't the right way to go about evaluating speed. Some players we were evaluating have been in the league for extended time and their speed is likely inaccurate. Players also rarely run 40 yards in a play. Using the tracking data, we calculated a player's get off speed within the first second of the play and 88% of a player's max speed throughout the eight weeks. The get off speed was calculated based off the code in a Big Data Bowl 2023 post by Tom Bliss, Michael Lopez, and Ally Blake. The 88% of max speed was created based off an article from SimpliFaster which talked about an athlete's peak sprint velocity. The graph shown in that article shows a speed of about 10 m/s at 2.25 seconds into the sprint, a good time stamp to use when evaluating a play. That speed is 88% of the max, which is where we get that percentage value. It is key to note that all speeds were converted into miles per hour within the code.
- Distance Between Players and the Quarterback
Then, we calculated the average distance between a pass rusher and the opposing quarterback 2.2 seconds into each play. We found the distance of both players at this instant by using the data points that corresponded to 22 frame ids after the snap, with each data frame being equivalent to 0.1 seconds. Some plays that developed very quickly were filtered out. Similarly, to evaluate offensive lineman, we calculated the average distance between the pass rusher they were blocking and the quarterback 2.2 seconds into each play. Distance is a good metric for testing performance as it shows how close the player can get to or push away from the QB. Lower numbers are better than higher numbers for pass rushers. The opposite goes for offensive lineman.
- Baselining Success Rating
In order to create an expected performance rating, similar to the comprehensive one created, we ran a multinomial linear regression model using all combine metrics, physical traits, double team rate, and the updated speed & distance metrics to predict the average actual success rating. We narrowed down all predictor variables to those 90% or more significant. We call this the predicted success rating.
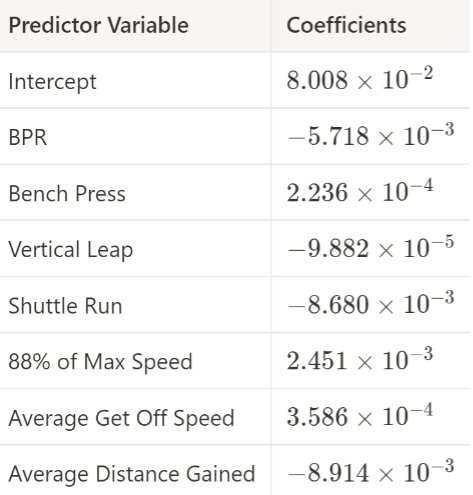
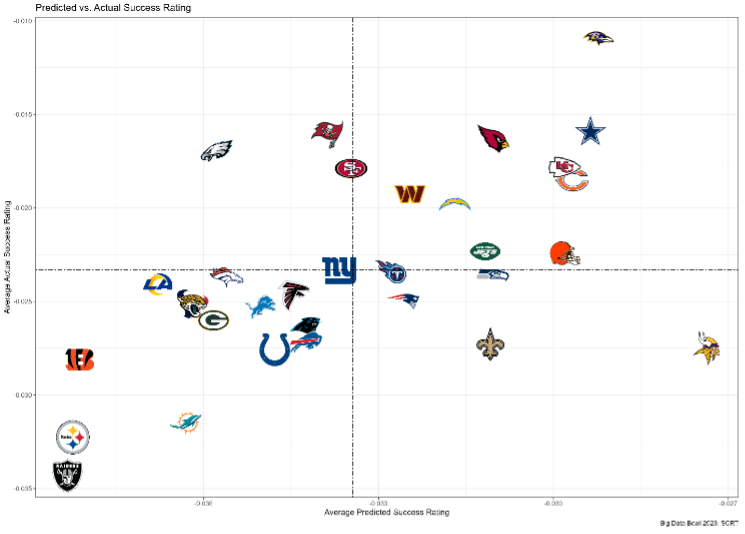
6.1. Defense
Here are the predictor variables and their coefficients for the defense.
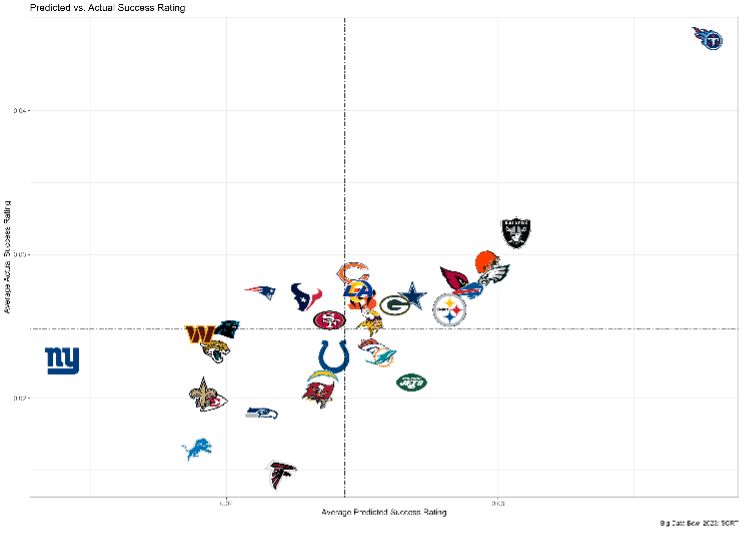
Here are the team defenses on a predicted success rating vs. actual success rating graph.
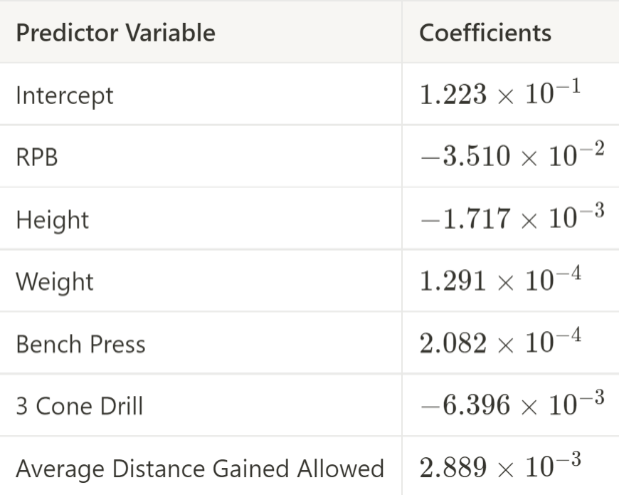
6.2. Offense
Here are the predictor variables and their coefficients for the offense.
Here are the team offenses on a predicted success rating vs. actual success rating graph.
- Creating SCRT
Once we found a player’s predicted success rating, we were able to calculate SCRT by subtracting this predicted success rating from their actual success rating. Players with a positive SCRT are those performing better than how they are expected to perform based on their physical traits and pure athletic ability. Players with a negative SCRT are those performing worse than expected. While SCRT is important because it demonstrates which players are over/under performing, the predicted value is also helpful as it gives a better look into how a player should be able to consistently perform throughout his career. We see players like Trey Hendrickson and Micah Parsons with high predicted SCRTs, which shows that they should perform at high levels for an extended period of time.
- Uses of SCRT
Between player, coach, and scheme evaluations, there are many practical applications of SCRT and predicted success ratings. Using predicted success ratings, organizations can see if a player is just performing well in that specific season or if they are actually expected to produce at a high level over an extended period of time. A similar concept applies to the expected goal model in soccer. A player with an xG of 4 may score 12 goals, but a player with an xG of 8 and only 8 goals is more likely to have better production in the future.
For example, let's assume player X has performed about as expected for the first three years of his contract, but has a relatively high SCRT in his final year of his contract. Should this player get a big contract extension? Since this year is an outlier, it is likely that his high SCRT is due to some combination of coverage sacks, teammates getting good pressure and pushing the quarterback in his direction, etc. We would advise being cautious giving this player a large extension because his production will likely decrease in the future
On the other hand, let’s assume player Y is coming off a down year and a team is debating whether or not to re-sign the player in free agency. If this player has a negative SCRT, our model says that this player ‘s production should increase and he will likely have more production going forward, so it would be smart to bring back this player on a team-friendly deal.
SCRT can even be used to evaluate team performance after the season. Cynthia Frelund released an article about overperforming and underperforming units of 2021 and ranked the Bengals' defensive pressure as the third most overperforming unit. If you look at our calculated SCRT values, four of the Bengals' pass rushers have a positive SCRT (overperforming) and only two have a negative SCRT (underperforming).
Ultimately, this thought process can be applied to any position and this does not have to stop at just passing plays. With future work and application, SCRT can be a very important evaluation tool that teams use daily. Below, we look at a few more pass play examples in detail.
- Examples
9.1. Player Specific Jaelan Phillips was an outside linebacker on the Miami Dolphins in 2021.
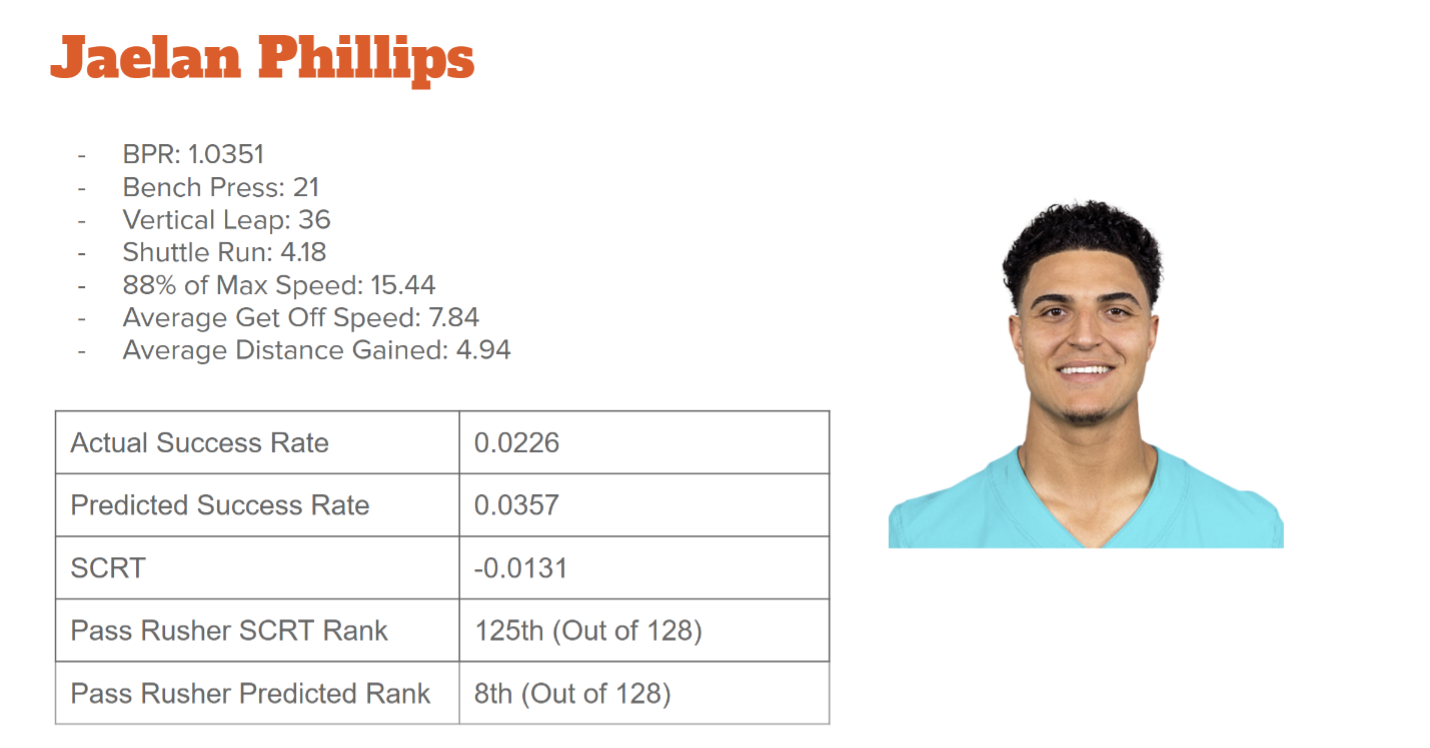
Phillips was the 3rd most underperforming player of the first 8 weeks in 2021. This is backed by his production with only 1.5 sacks. However, our prediction model suggested he would eventually play at a much higher level and actually ranked 8th in predicted success rating. This held true as he positively regressed to his predicted value with 14 sacks since week 8 of the 2021 season.
Brandon Scherff played offensive guard on the Washington Commanders in 2021.
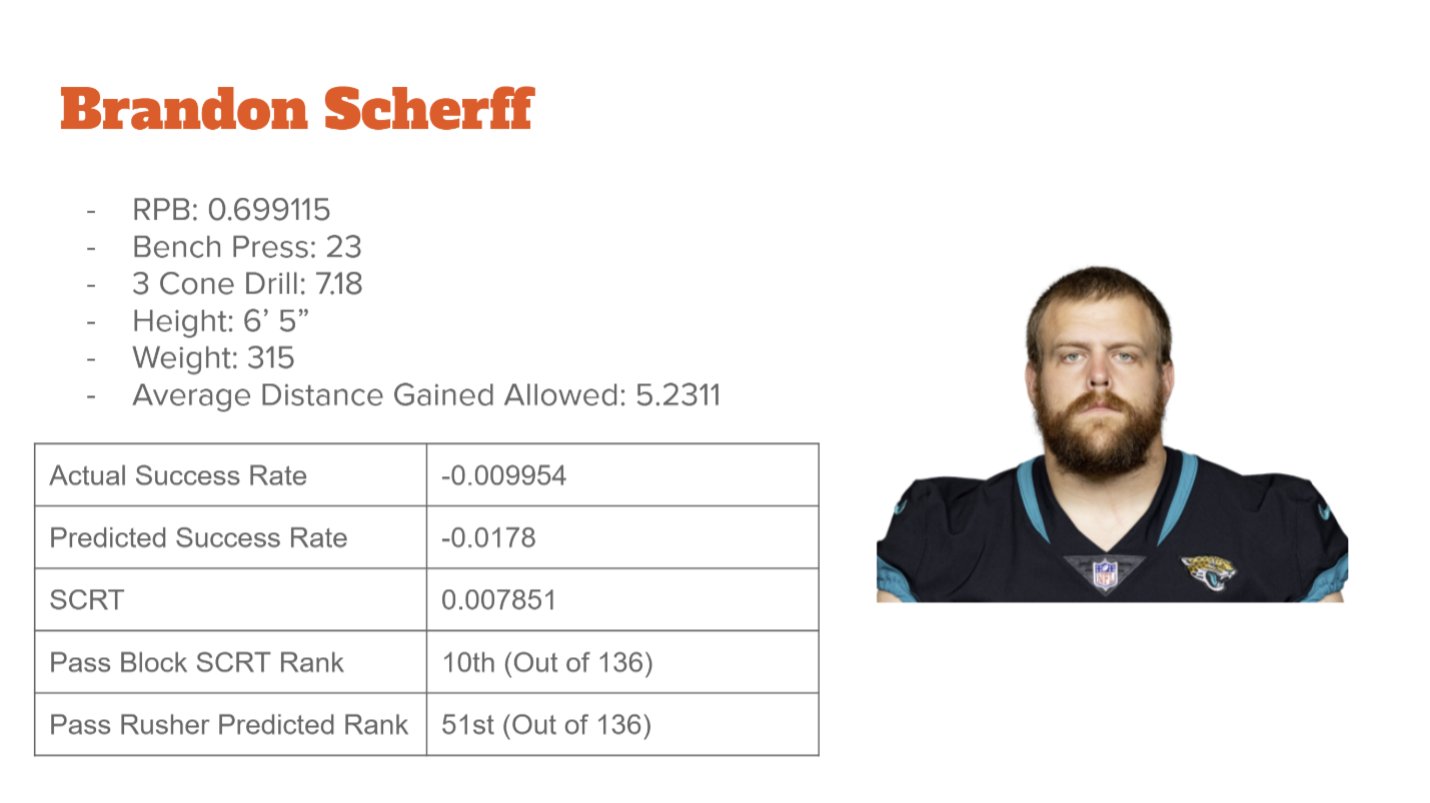
Scherff is another example of a player who followed our model's prediction. According to actual success rating, Scherff was the 11th highest ranked offensive lineman from week 1 to 8 last year. However, Scherff wasn't even predicted in the top 50, making him the 10th overproducing lineman. Scherff has regressed closer to his predicted success rating, demonstrated by the fact that he has given up 5 sacks this year (compared to 0 in the first 8 weeks of 2021).
9.2. Team Specific
PFF released an article titled, "Ranking the NFL's best defensive play callers ahead of the 2022 season" and ranked Raheem Morris of the LA Rams 4th
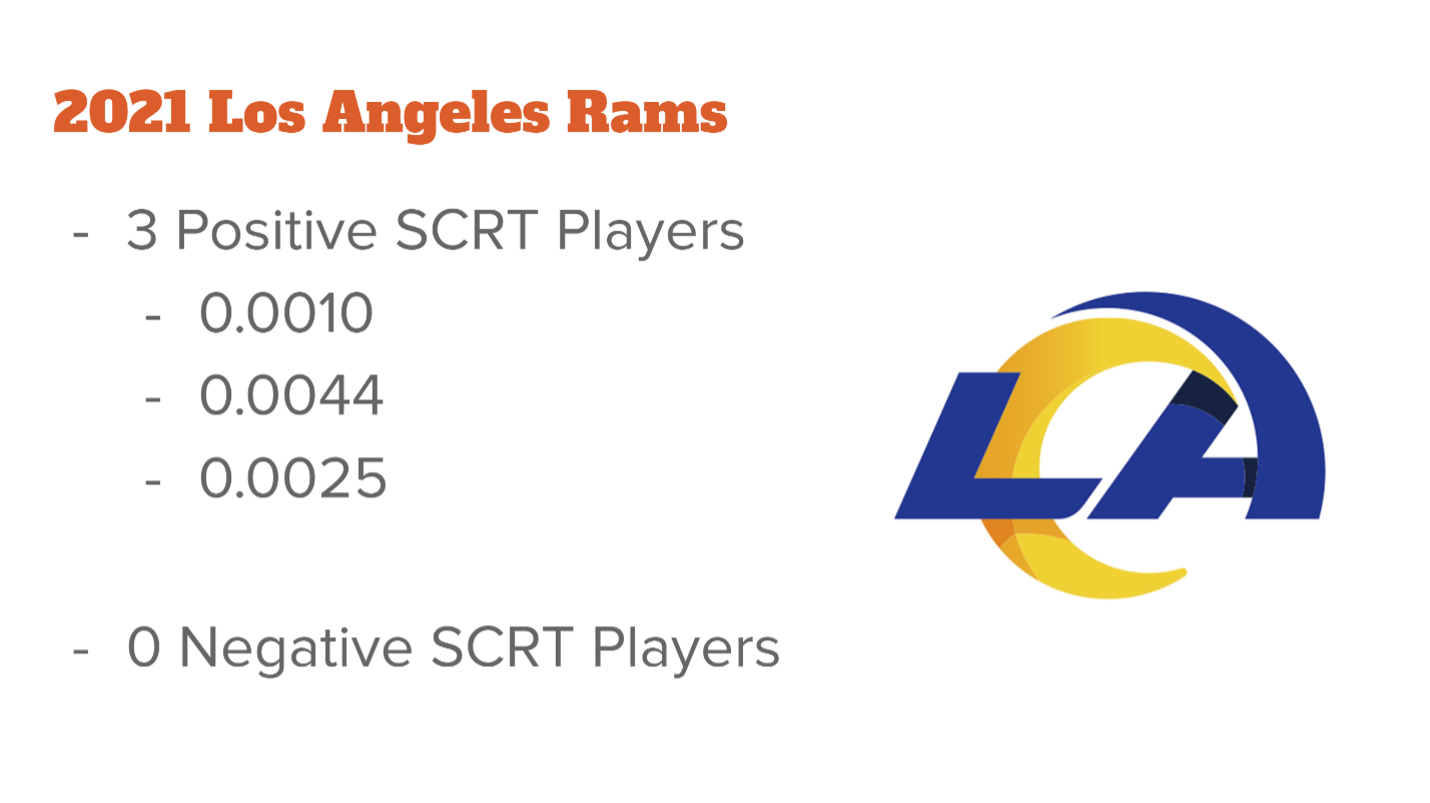
Here we can see that the Rams had a well performing pass rush defense in 2021 in comparison to how they were expected to perform. Front offices can evaluate their coaching staff and see if they call the best packages and plays to help their defense succeed. The data holds that claim true for Morris.
In 2021, the Broncos had a very overperforming offensive unit as we see here:
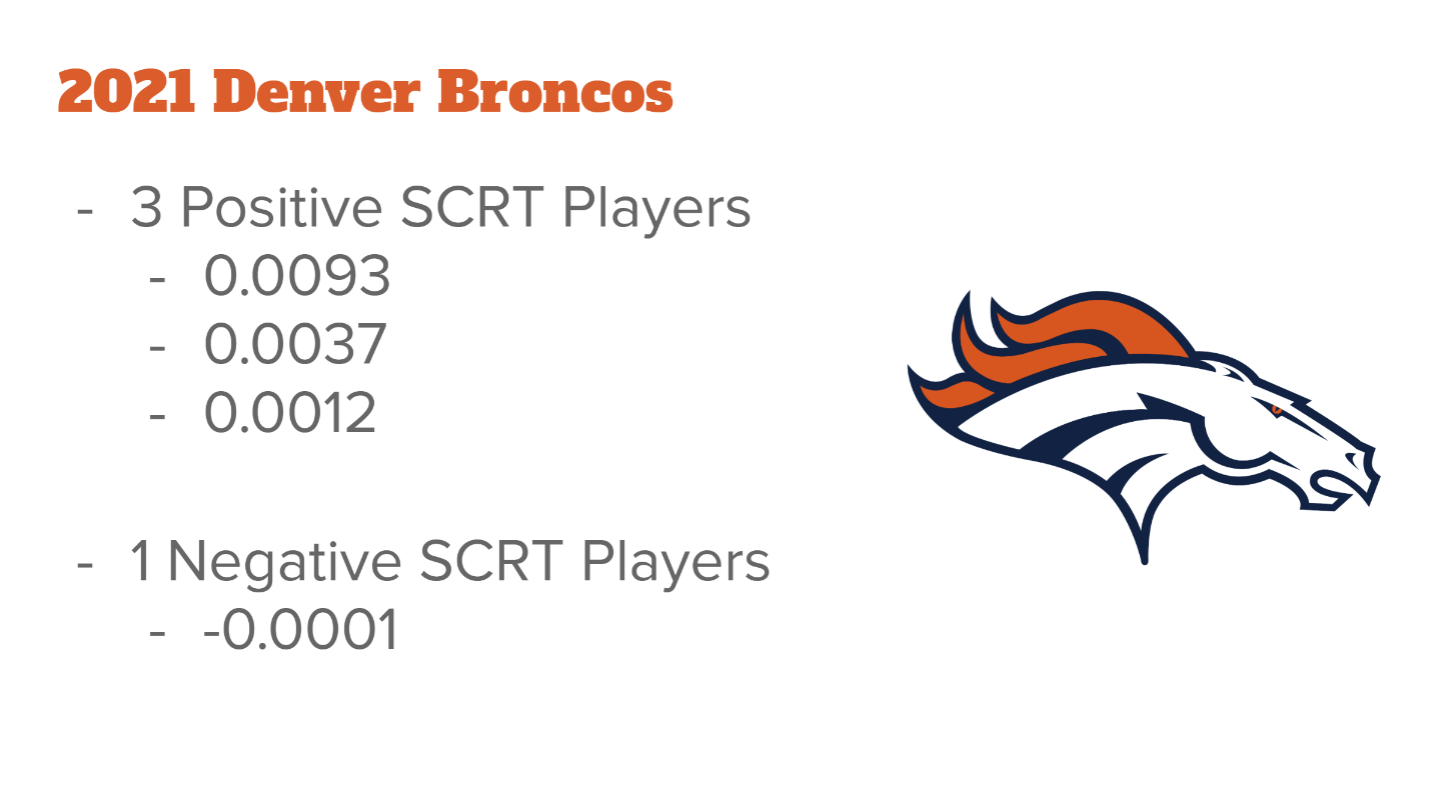
It is also safe to assume these players have regressed closer to their predicted performance as in 2022, the Denver Broncos have allowed the most sacks out of any NFL team this season (61).
- References/Sources
Summer, Ella. Interview. Conducted by Team. 8 December 2022.
Stern, Alex. Interview. Conducted by Team. 26 December 2022.
Bliss, Thompson; Lopez, Michael; Blake, Ally (2022). "Pass Rushing Edge Get Off Speed". Kaggle.
Eager, Eric (2022). "Ranking the NFL's best defensive play callers ahead of the 2022 season". PFF.
Frelund, Cynthia (2022). “NFL's Five Most Overperforming/Underperforming Units of 2021 Season: Mac Jones, Take a Bow!” NFL.
Simpson, Robert (2022). “EPA Explained.” The 33rd Team.
Valle, Carl (2020). “Why Every Athlete Should Be Tested for Peak Sprint Velocity.” Simplifaster..
- Appendix
- Github Repository
- Actual Success Rating: comprehensive rating of either an offensive lineman or a pass rusher based on his in-game performance and statistics.
- Predicted Success Rating: comprehensive rating of either an offensive lineman or a pass rusher created by a regression model based on his physical traits, combine metrics, double team rate, and in-game speed metrics.
- SCRT: Actual Success Rating subtracted from Predicted Success Rating
- BPR: blockers per rusher; double team rate for defensive players
- RPB: rushers per blocker; double team rate for offensive players
- Authors
We are a group of undergraduate students from the University of Virginia and University of Illinois Urbana-Champaign. We met each other on reddit and formed a group to create a submission for the 2023 NFL Big Data Bowl.
 Joe Leonard (University of Virginia): ymd3tv@virginia.edu / joseph.leonard725@gmail.com
 Bennett Ross (University of Virginia): bfc9jj@virginia.edu / bennettross18@gmail.com
 Lakshay Maharana (University of Illinois): lakshay3@illinois.edu / lakshaymaharana1@gmail.com
 Chirag Mehta (University of Illinois): chiragm3@illinois.edu / mehtachirag2002@gmail.com