Having the role of a head coach in the NFL comes with the challenge of battling through adversity. Depending on who the coach is, it can be the difference in a team having a positive or negative influence on their performance. The eye test can tell many things about a coach. This study will use data to discover new insights and interpretations about coaches and their ability to either lead a team to improve or struggle on a decline.
Data Collected
All data within the study is from the website Pro Football References, which provides decades' worth of data. Data was collected to create a single metric that measures the performances of all coaches and their teams. Data includes from the most current year of 2022 back to 2003, including each regular season game. Data from the playoffs and the most recent week 18 from the 2021 and 2022 seasons were not included in the study, so the data observation per season for each coach and team can be distributed evenly. The study examines an equal amount of 16 games per team per season since each team also has a bye week.
Performance Variables
The created metric utilizes performance variables such as points, points allowed, yards allowed, point margin, and turnovers forced to measure the team and coach's performances because they are key factors that contribute for winning games. Points represent the number of points the team could score within that game. Points allowed represents the number of points a team allowed their opponent to score. Yards represent the number of yards a team was able to produce. Yards allowed is the number of yards a team permits an opponent to make. Point margin represents the point differential between a team and their opponent. Turnovers forced represent the total number of interceptions and fumble recoveries a team could force.
A correlation test was conducted within the variables to see how strong their relationship is with the NFL's performance of winning games. Based on the correlations, a measurement will be assigned for each variable based on the weight of the correlation.
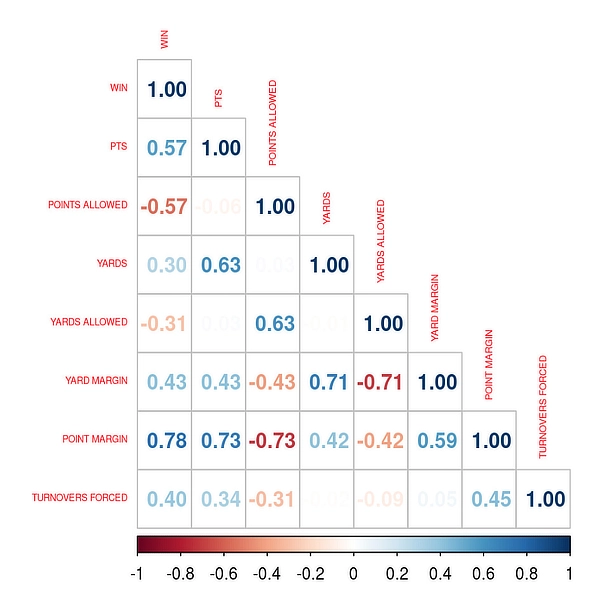
Point margin has the highest correlation with winning (positively strong); therefore, the metric will be weighed in favor of the team's Point Margin, followed by points and points allowed (positively/negatively moderate), turnovers forced (positively moderate), and lastly, yards and yards allowed (positively/negatively weak).
Creating performance metric
The metric works by assigning a value for each variable based on how a team performs within a game. For instance, if a team could produce 35 points, they would get 4 points for the point variable. Let us say that the same team creates two turnovers; then, they will be assigned a value of 2 points for the turnover variable. After each variable has a given value, all the values from the variables will total to create a single metric that measures the team and coach's performance.
Table for the metric values
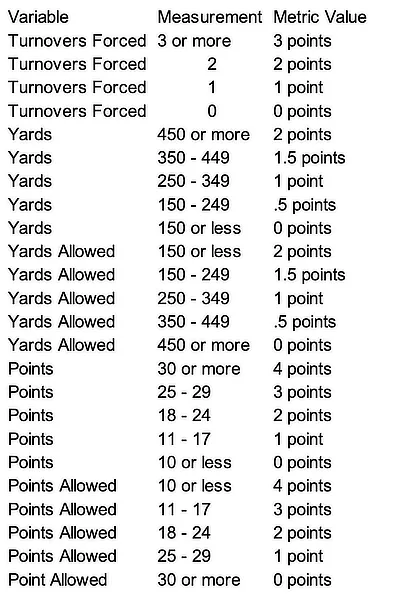
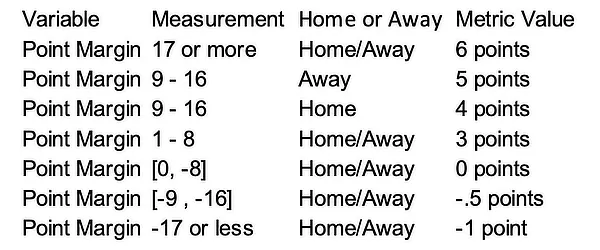
Point Margin is rewarded the most points since it is the strongest correlated. A home variable was added to the metric value of the point margin to display different game situations. Ex. Losing on the road by one possession should be valued differently than losing at home by multiple possessions.
Ex. John Harbaugh's 2019 season with the Baltimore Ravens
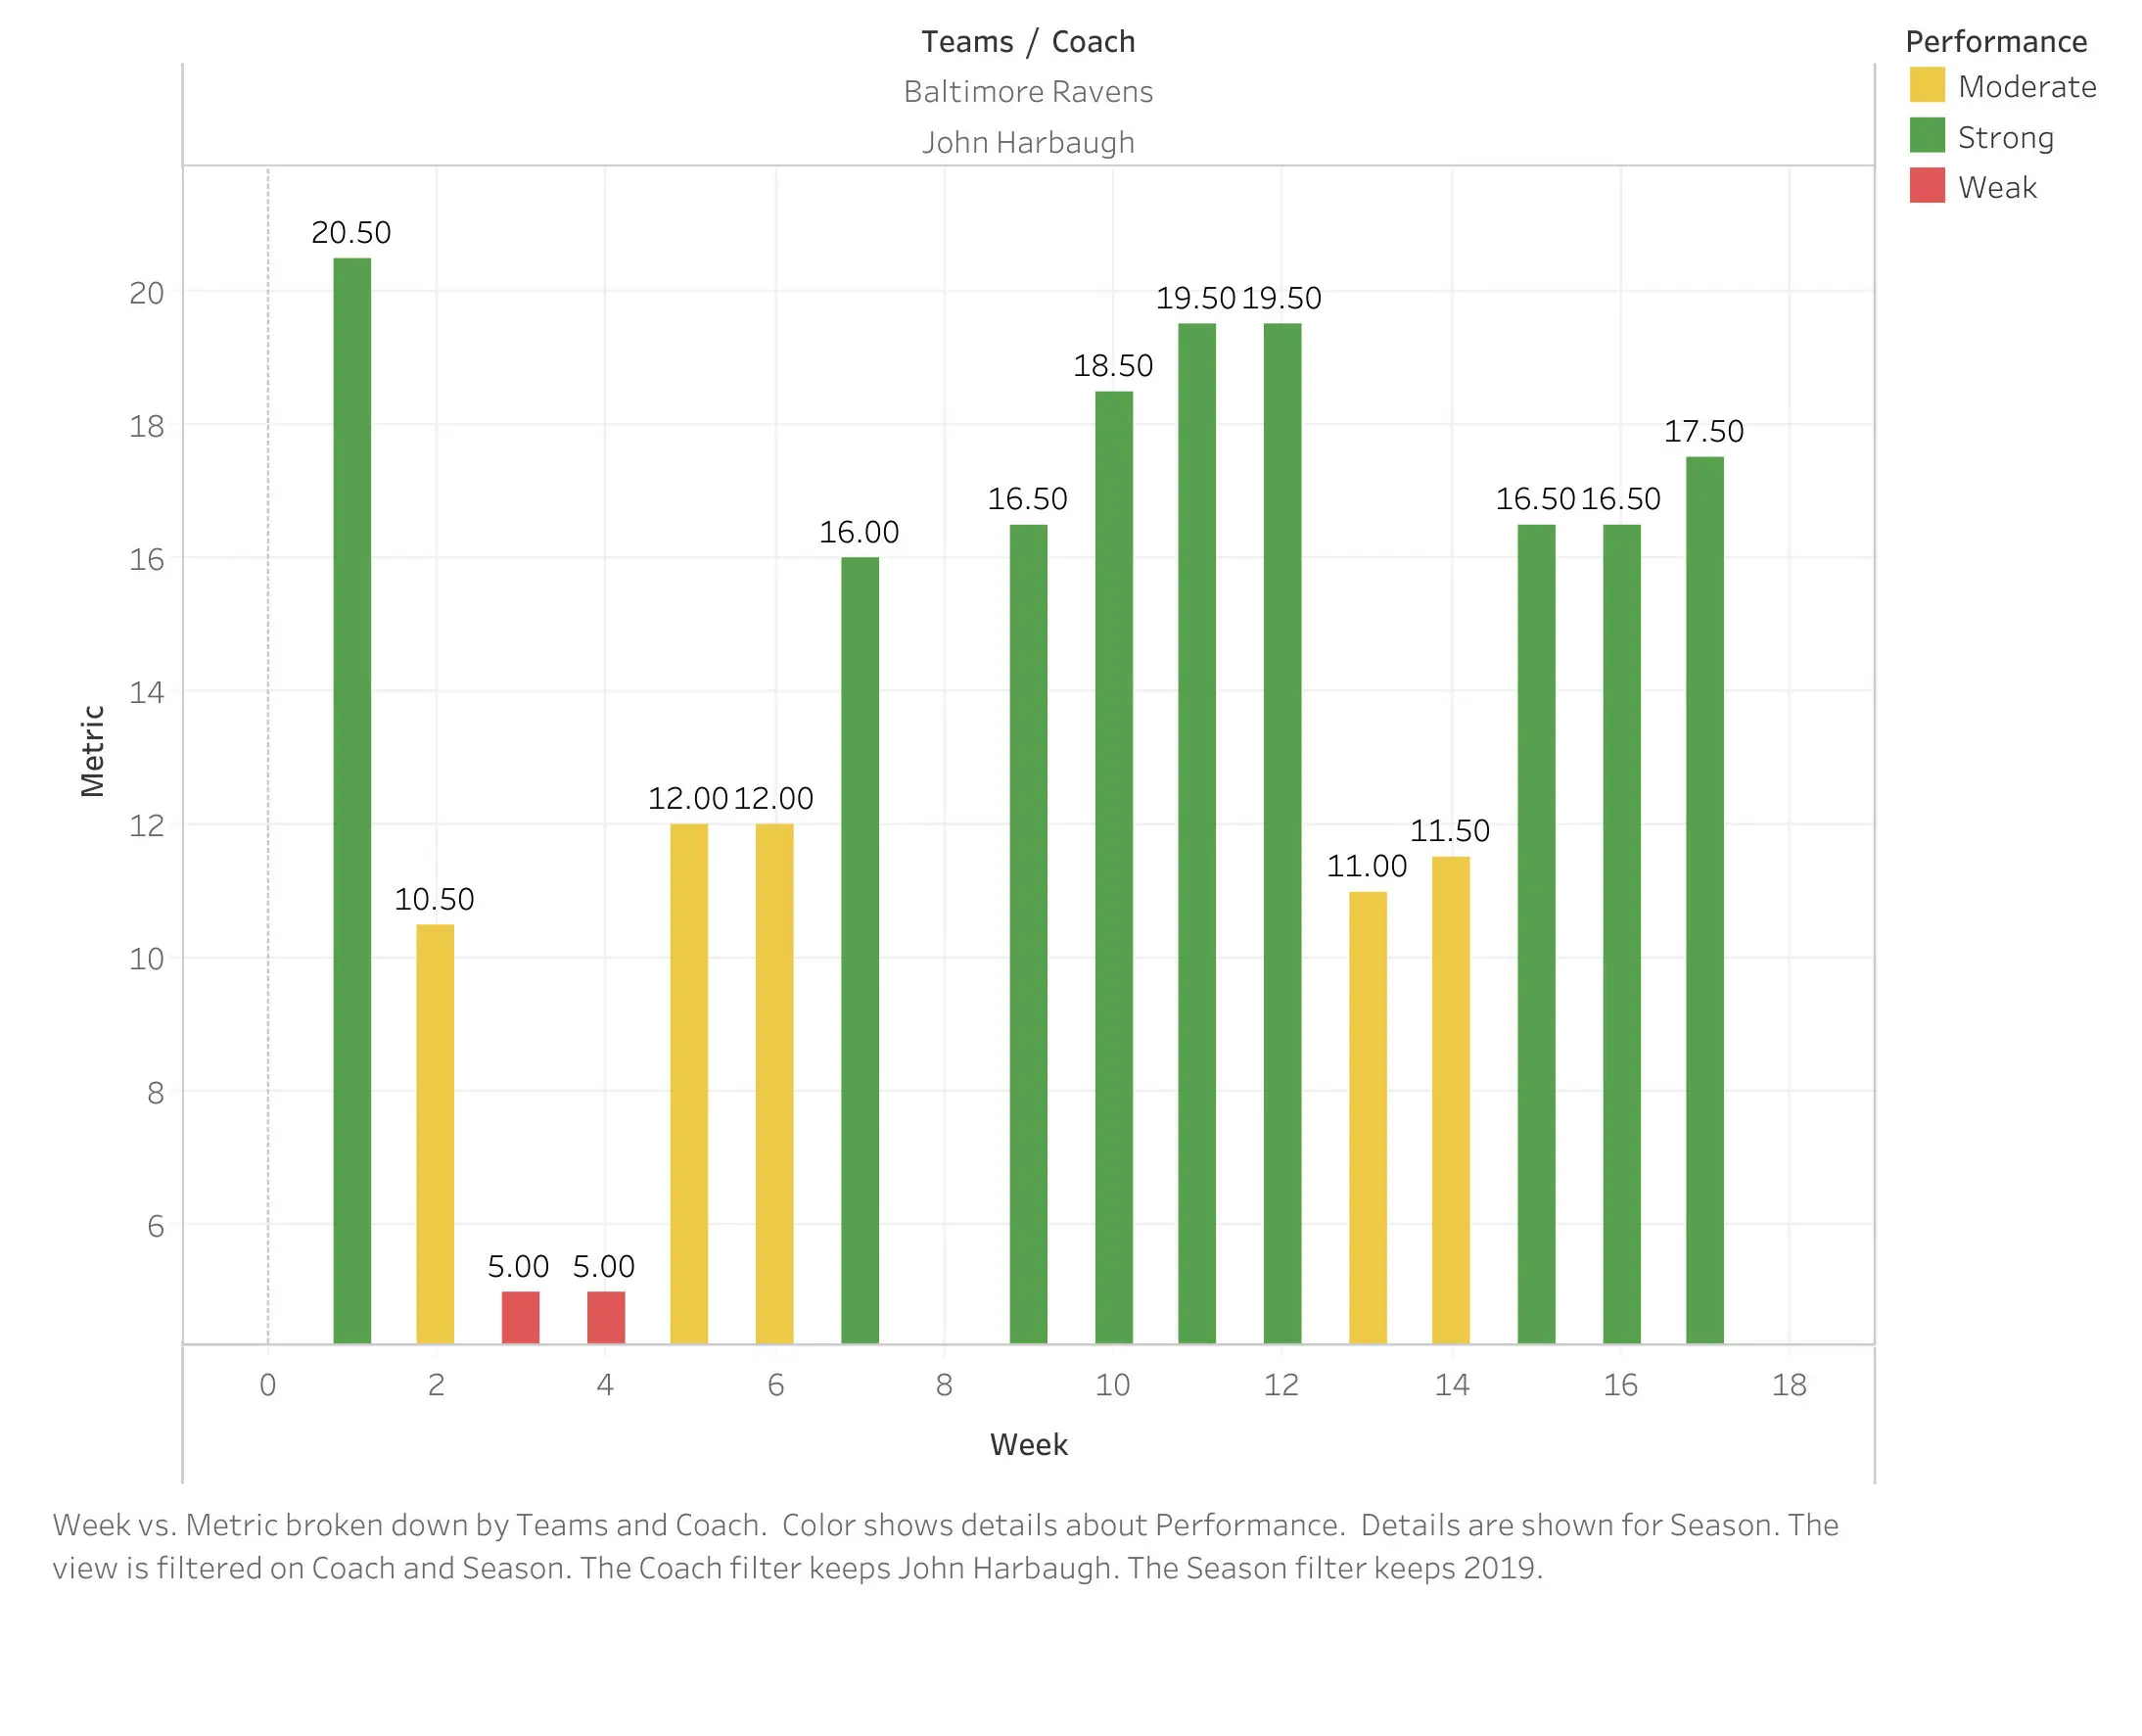
The Baltimore Ravens, led by John Harbaugh, had a winning record of 14 - 2 in the 2019 season. Their only losses came from weeks 3 and 4, where they had their lowest performance metrics (5.0) against the Kansas City Chiefs and Cleveland Browns. Their highest performance metric (20.5) was from week 1, where they defeated the Miami Dolphins 59 - 10.
To further examine the performances of coaches, The metric for each of the 16 games per season was divided into groups
- the first period is the first four games of the season
- the second period is the next four games after the first period
- the third period is the next four games after the second period
- the fourth period is the last four games of the season
An example of the Baltimore Ravens' very dominant win over the Miami Dolphins in 2019, where they finished with a 5 -11 record, the metric was averaged by period to eliminate any bias that a team happens to play a much inferior opponent consistently in back-to-back weeks.
A trend line can represent whether a coach's team improved, regressed, or stayed neutral by measuring the coach's season by period.;
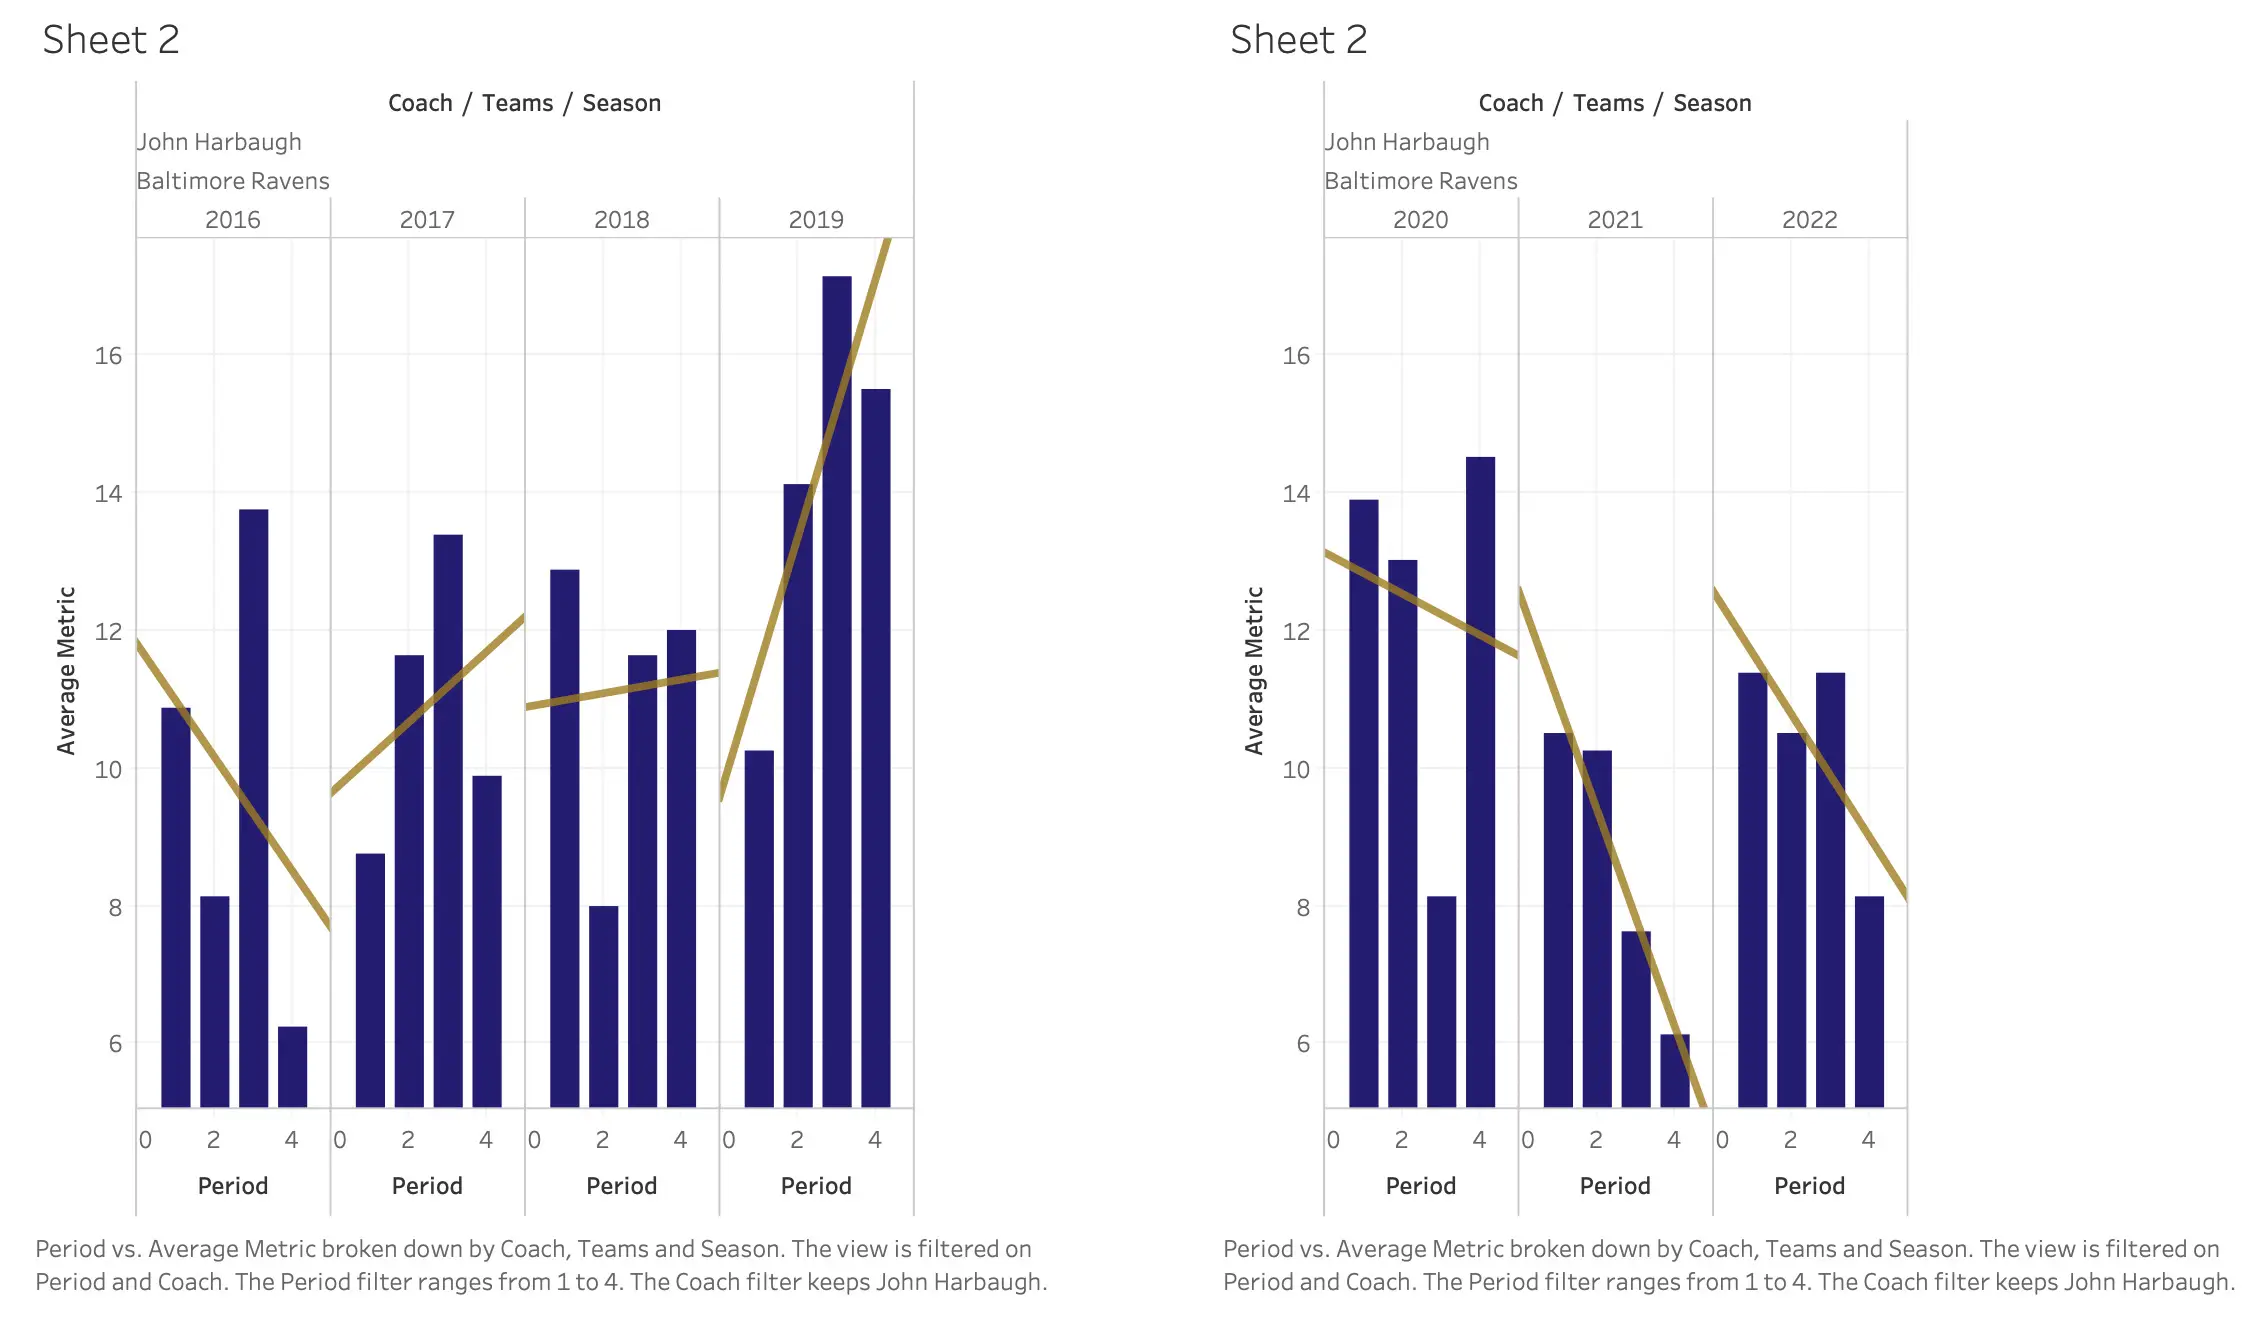
Ex. John Harbaugh's latest career
Trend Lines
Positive trend lines represent coaches that improved team performance from the start of the season to the end (first to fourth period)
Negative trend lines represent coaches that regress in team performance from the start to the end of the season.
The trend of the lines for each coach can be averaged over their career to gather a career performance for each coach.
Remember that the data was only taken from the regular season and does not apply to any playoff data.
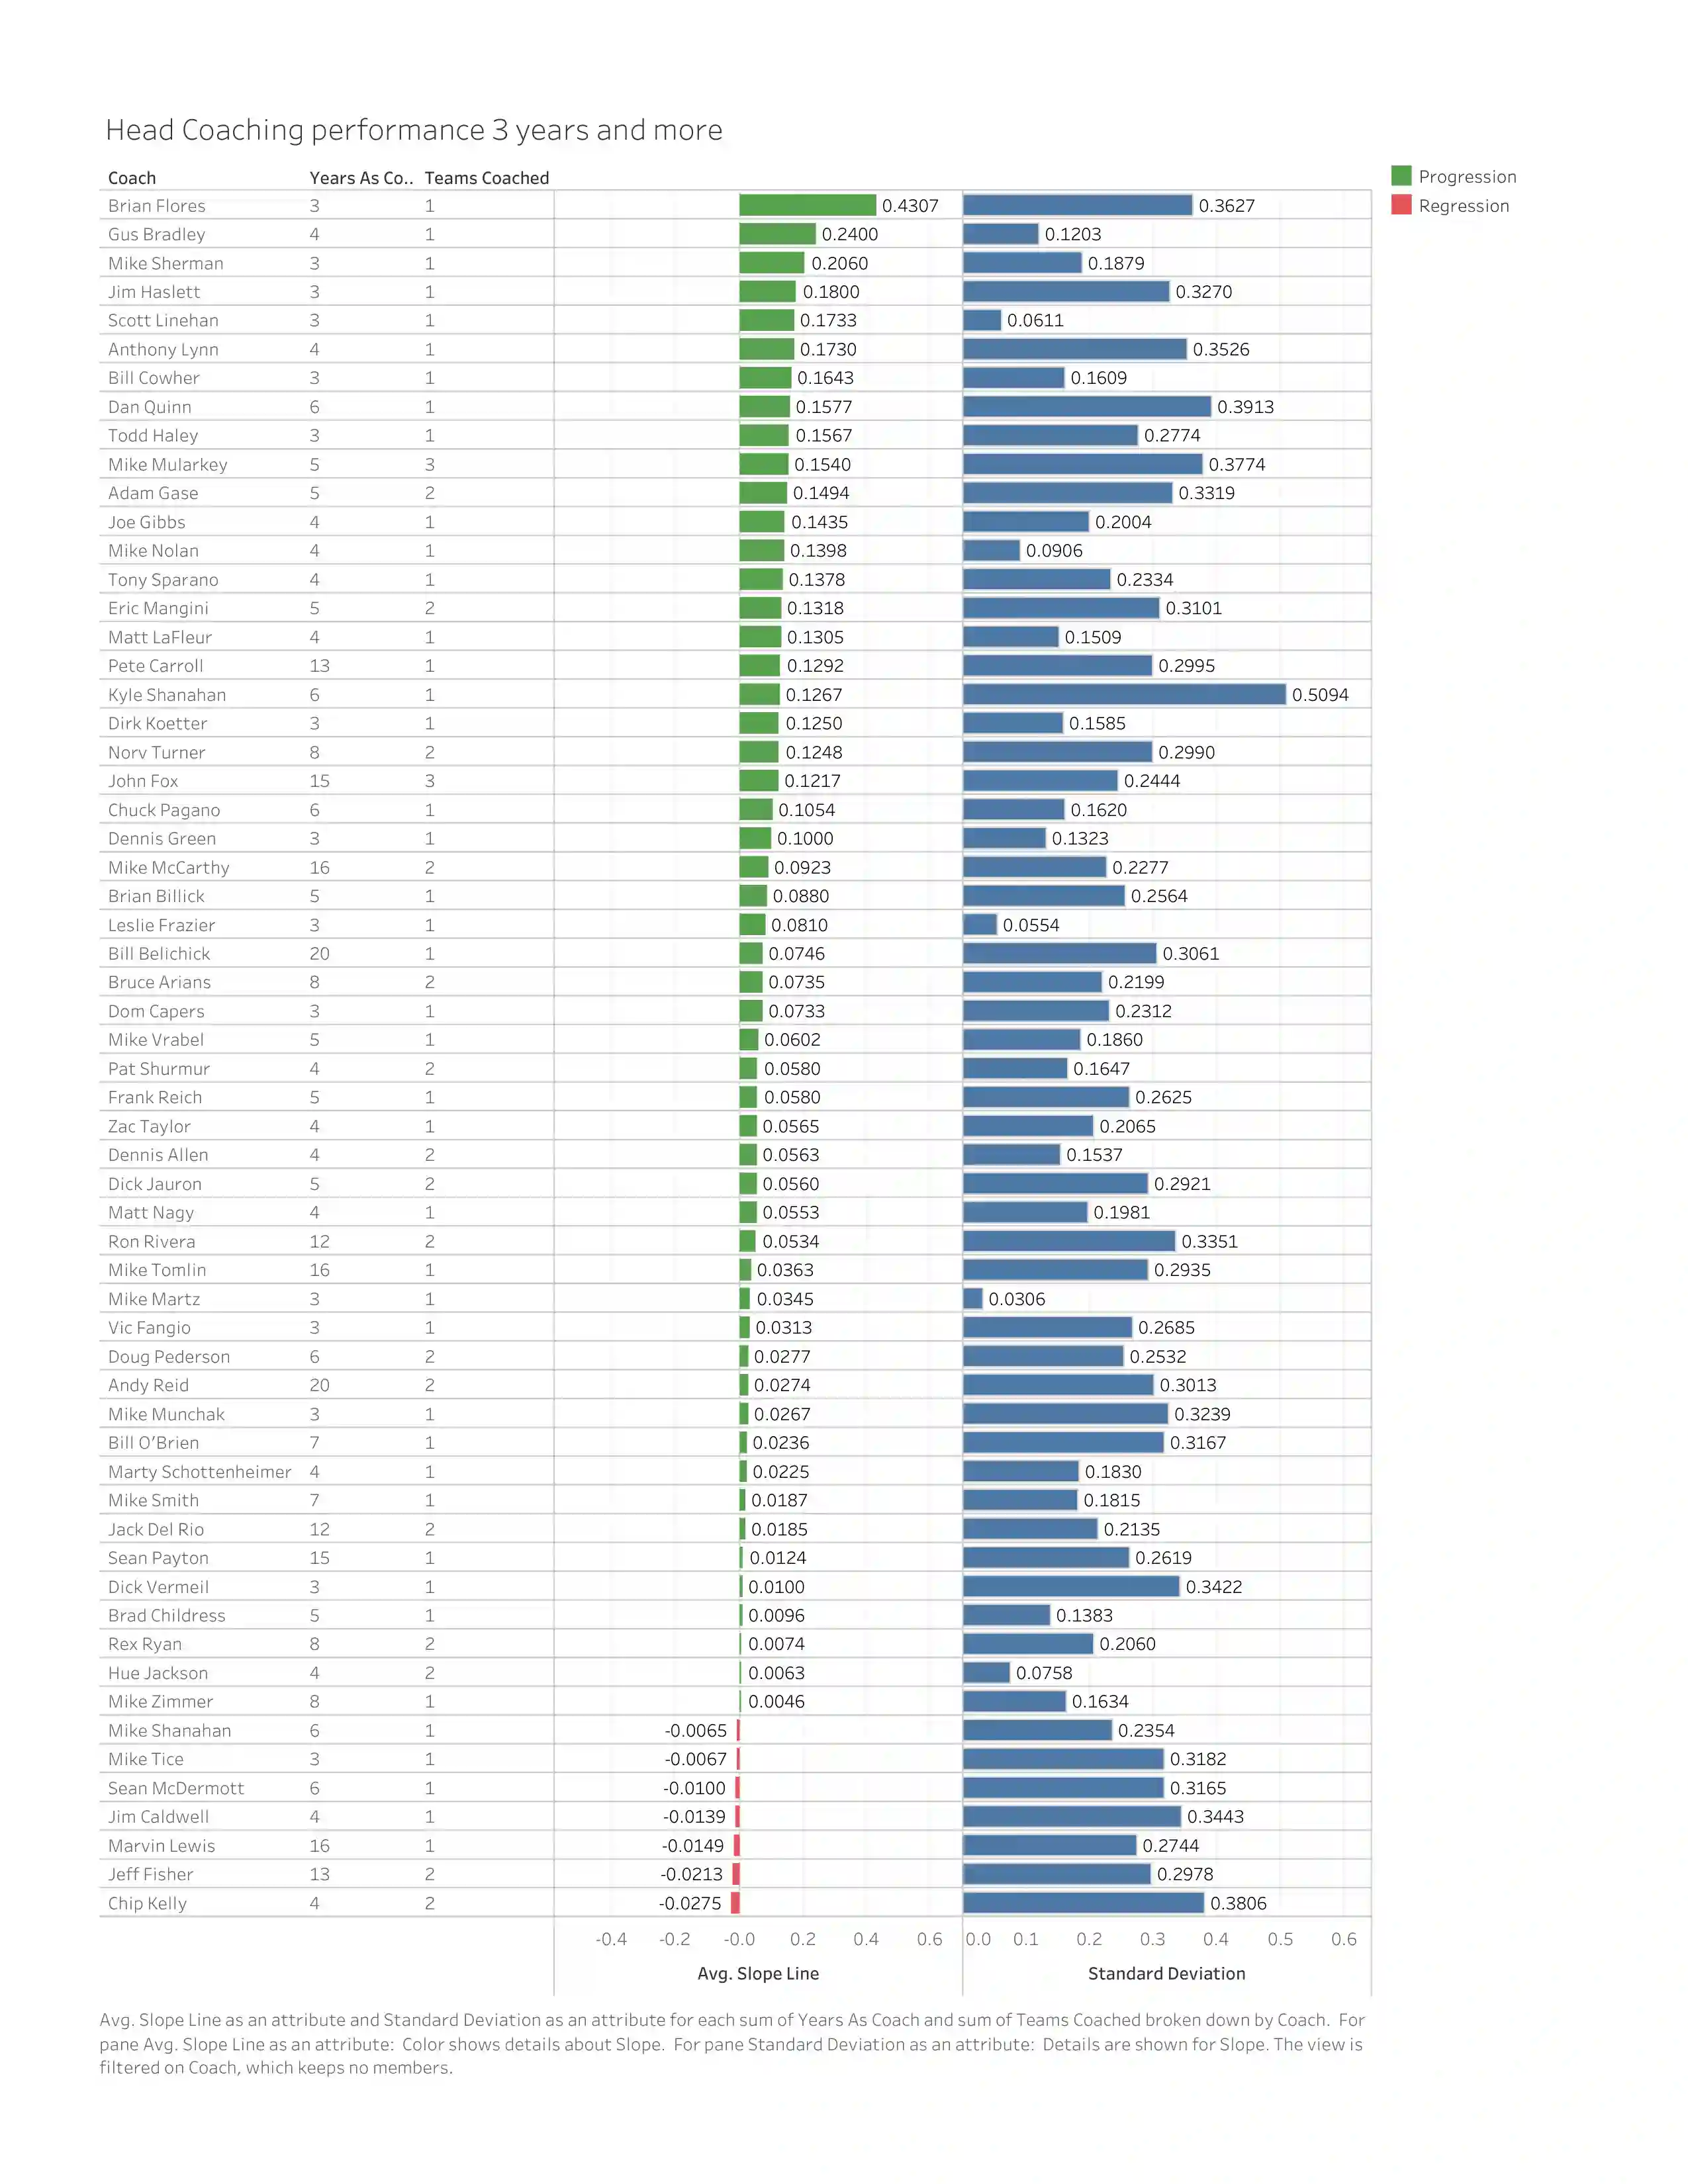
The visual shows the average trend through head coaches' careers. The data was subset to show head coaches who had coached for at least three seasons. The visual provides the standard deviation for each coach to show how clustered or compact the data is from the mean or, in the instances of the study, how consistent or inconsistent coaches were throughout their careers.
Evaluations and Findings
Brian Flores had the highest trend average for coaching performances throughout his three seasons as a head coach, having the biggest performance improvement for his team. Flores turned things around in Miami after going 5 - 11 in his first season in 2019 and improving with a 10 - 7 record in 2020 and a 9 - 8 record in 2021. In just three seasons as a head coach, Flores finished with two winning seasons, which shows the questioning of his controversial department with Miami. Flores had the 11th highest standard deviation among coaches, which can be indicated by the fluctuation with his 2020 season, where he only had a slight improvement, compared to his 2019 and 2021 seasons, where he had massive improvements from the first period all through the fourth-period games.
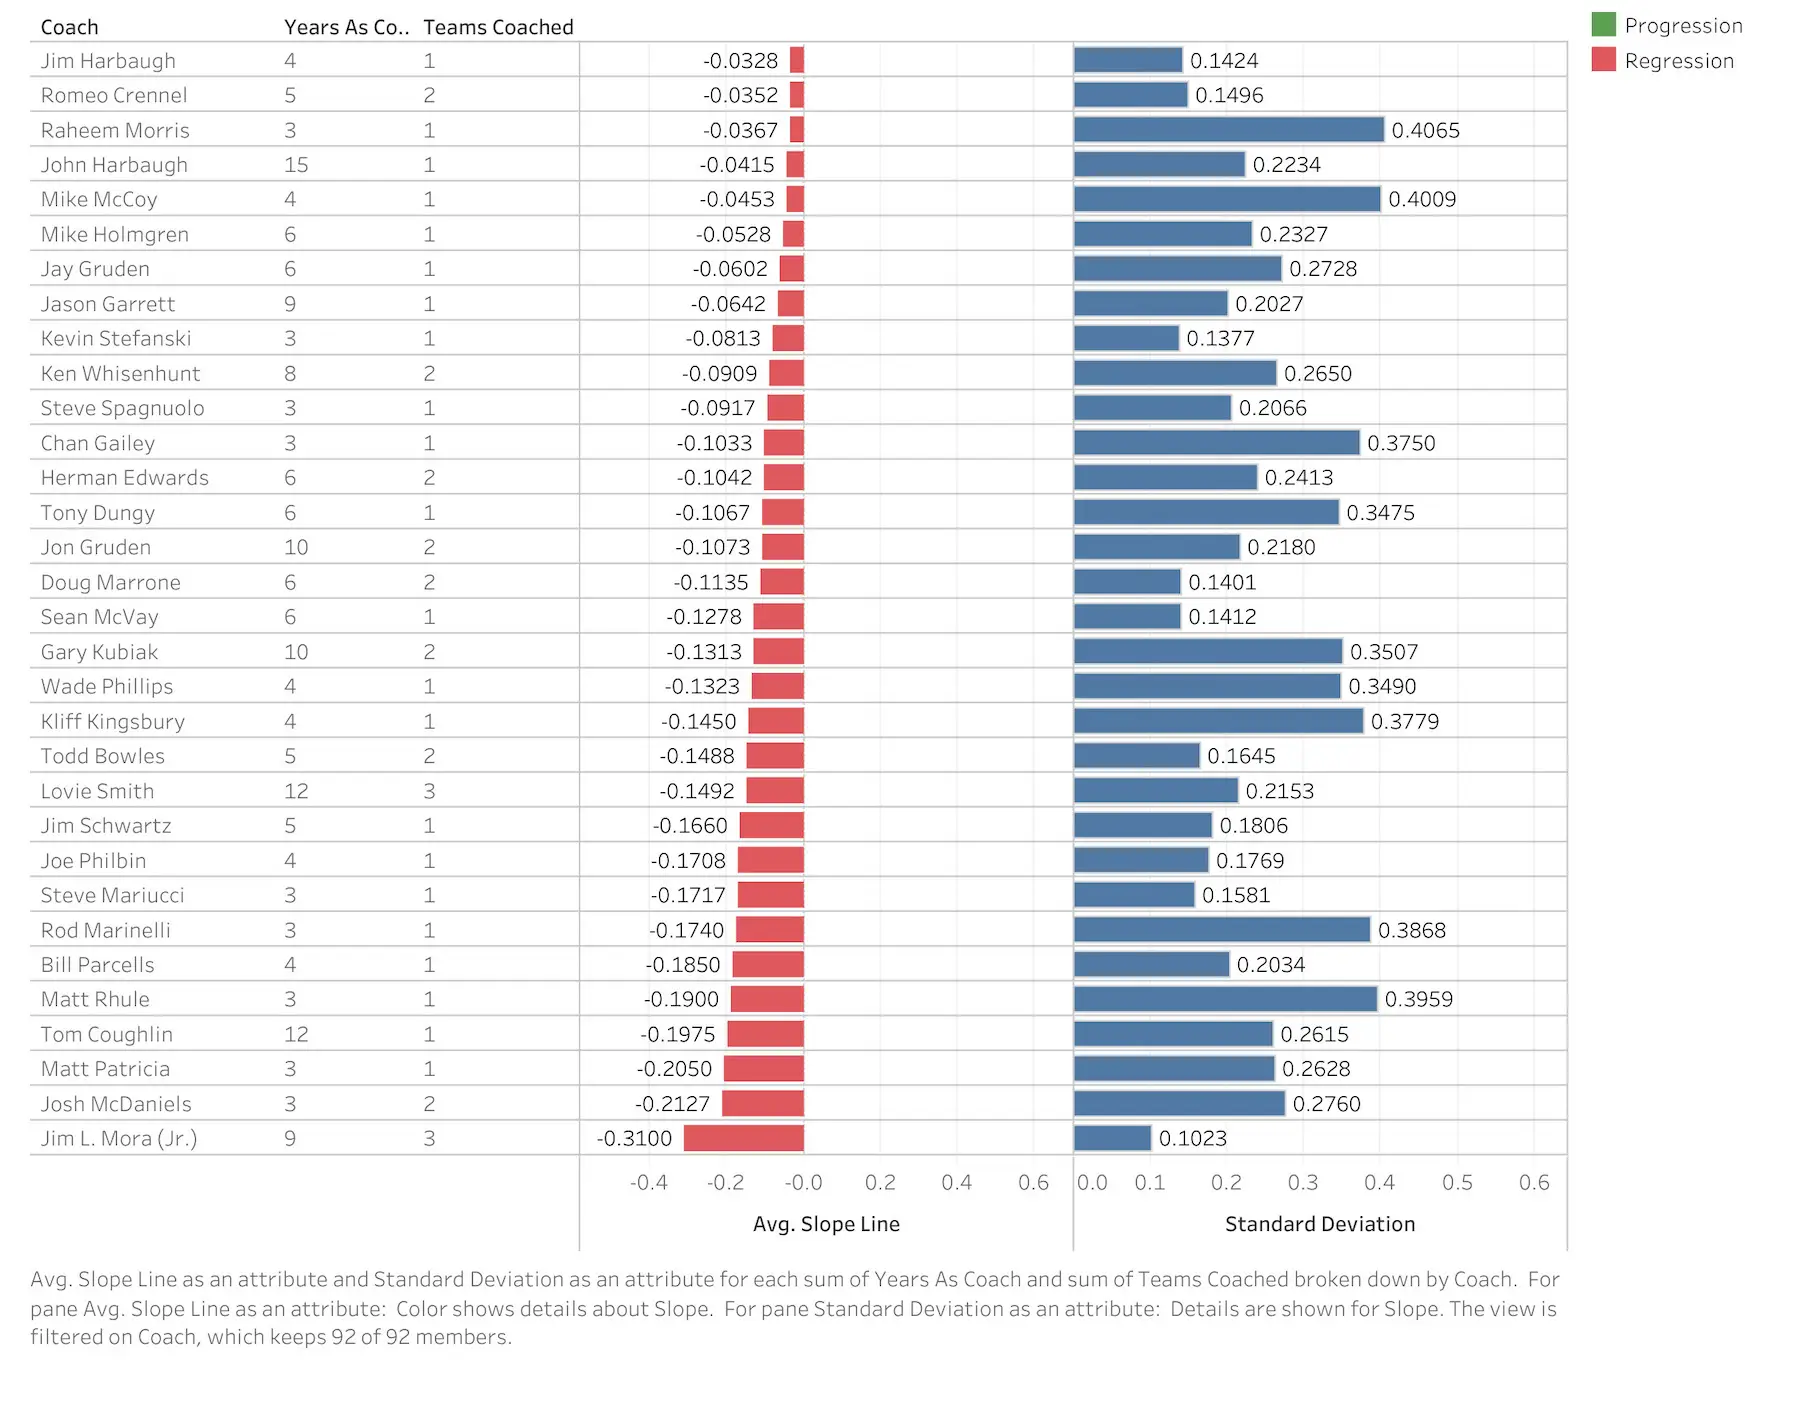
Josh McDaniels, who has recently been fired from the Las Vegas Raiders, has shown from the graph to have had the second-lowest trend average for coaches with at least three seasons in the past two decades. He has had a record of 8 - 8, 4 - 12, and 6 - 11 seasons in his three seasons as the Broncos and Raiders coach. The standard deviation shows that Josh McDaniels had his best coaching in 2009 with the Denver Broncos for the first period. Still, unfortunately, performance drastically continued to fall until the fourth period of that year, which shows why he had his largest regression trend that year. From the data, 2009 with the Denver Broncos would be his worst year of coaching, followed by another year with the Broncos in 2010. 2022 with the Las Vegas Raider showed some improvement throughout the year, with an increase in his performance during the 3rd period. Even though in 2010, when McDaniels had his worst coaching record of 4 - 12, that year was more consistent with McDaniels and the Broncos struggling, compared to 2009, when the Raiders started at their peak performance (15.38) and had a 227% regression in their metric performance (6.75) that season.
Mike Martz had the most consistent career as head coach because he had the lowest standard deviations out of the coaches in the visual. All three of his coaching seasons were with the St. Louis Rams from 2003 - 2005. Martz improved his team throughout his first year as the head coach, followed by a consistent performance year in 2004. In 2005, Martz had a regression due to a drastic drop in the third-period games but improved to a consistent performance level at the end of that year.
Limitation
The study should address the most significant limitation of resting the starters, which is when teams willingly substitute backups for starters so they will be healthy and rested for the playoffs. It usually occurs for teams that have clinched the playoffs before the season has finished. In 2020, Andy Reid and the Kansas City Chiefs were able to clinch a playoff spot in just week 14 and secure the first seed in week 16 of the regular season. Andy Reid decided to sit out most of the starting lineup for the last regular season game before the playoffs started. As a result, Andy Reid's performance metric dropped about 50% from what he was averaging that season. Due to the decisions coaches and teams make, the metric is still measured by team performance, excluding whoever is on or off the field. Because of the limitation, substituting starting lineups affects the coach's performance metrics, explaining why some coaches will have regressions throughout their season.
Sources
All data was collected and composed from pro-football-reference.com
About the Author

Cameron Roberts is a current Junior at California Baptist University. He is majoring in Sports Analytics with a concentration in Sports Performance Analytics. Cameron is passionate about sports, especially football, which has opened a desire for him to work closely with or for a professional sports team.