
WAR, or wins above replacement, is an advanced baseball statistic that attempts to measure the total value provided by a player. Using a comparison in relative wins over the course of a season, we can see how valuable a player is as compared to a “replacement” player, essentially a player readily available to any team for the league minimum salary. If a player has 6 WAR, they added 6 “wins” to their team and were 6 “wins” better than a replacement-level player.
WAR has become a widely accepted statistic in the media and is often a point of consideration for annual awards such as the Cy Young and MVP. It can provide a quick snapshot to the value of a player and allow for comparisons across positions and even years. For example, the AL MVP Aaron Judge and the NL Cy Young award winner Sandy Alcantara led position players and pitchers respectively, in WAR for the 2022 season. While this is not the only deciding factor for who wins those awards each year, a review of the past 10 seasons confirms there has not been a Cy Young or MVP award winner that has been outside the top 10 in fWAR or bWAR (for pitchers or position players) for the associated season.
Types of WAR
Although there are several different types of WAR, I will focus on the two which receive the most attention. It can be challenging to understand this catch-all statistic, especially since there are multiple different places that calculate it. The two primary types are:
- fWAR (calculated by fangraphs.com).
- bWAR/rWAR (calculated by Baseball-Reference).
The sources of these calculations are sabermetric websites that are dedicated to baseball statistics. Each have massive databases on every player that has appeared in recorded MLB history.
The Fangraphs and Baseball-Reference websites separate WAR for position players and pitchers. How WAR is allocated differs slightly between the two, but they are similar enough to compare. Both sites start with 1000 WAR per 162 games to allocate across all players. Fangraphs allocates 570 WAR for position players and 430 WAR for pitchers, while Baseball-Reference allocates 590 WAR for position players and 410 WAR for pitchers. This essentially means Fangraphs believes pitchers have 2% more impact on the game compared to Baseball-Reference. While this is not a massive difference, it is something to remember when looking at WAR allocation as well as differences in certain players’ fWAR and bWAR. We’ll detail these different calculations for position players and pitchers below.
To begin the comparison of different WAR calculations, let’s look at data from the 2022 season. Figure 1 offers a comparison of the top 10 players from the 2022 MLB season (selected by fWAR, widely recognized as the most popular) and comparing their bWAR. As seen in the graph, bWAR and fWAR typically only slightly differ from player to player, but this can lead to different evaluations of the value that a player provides.
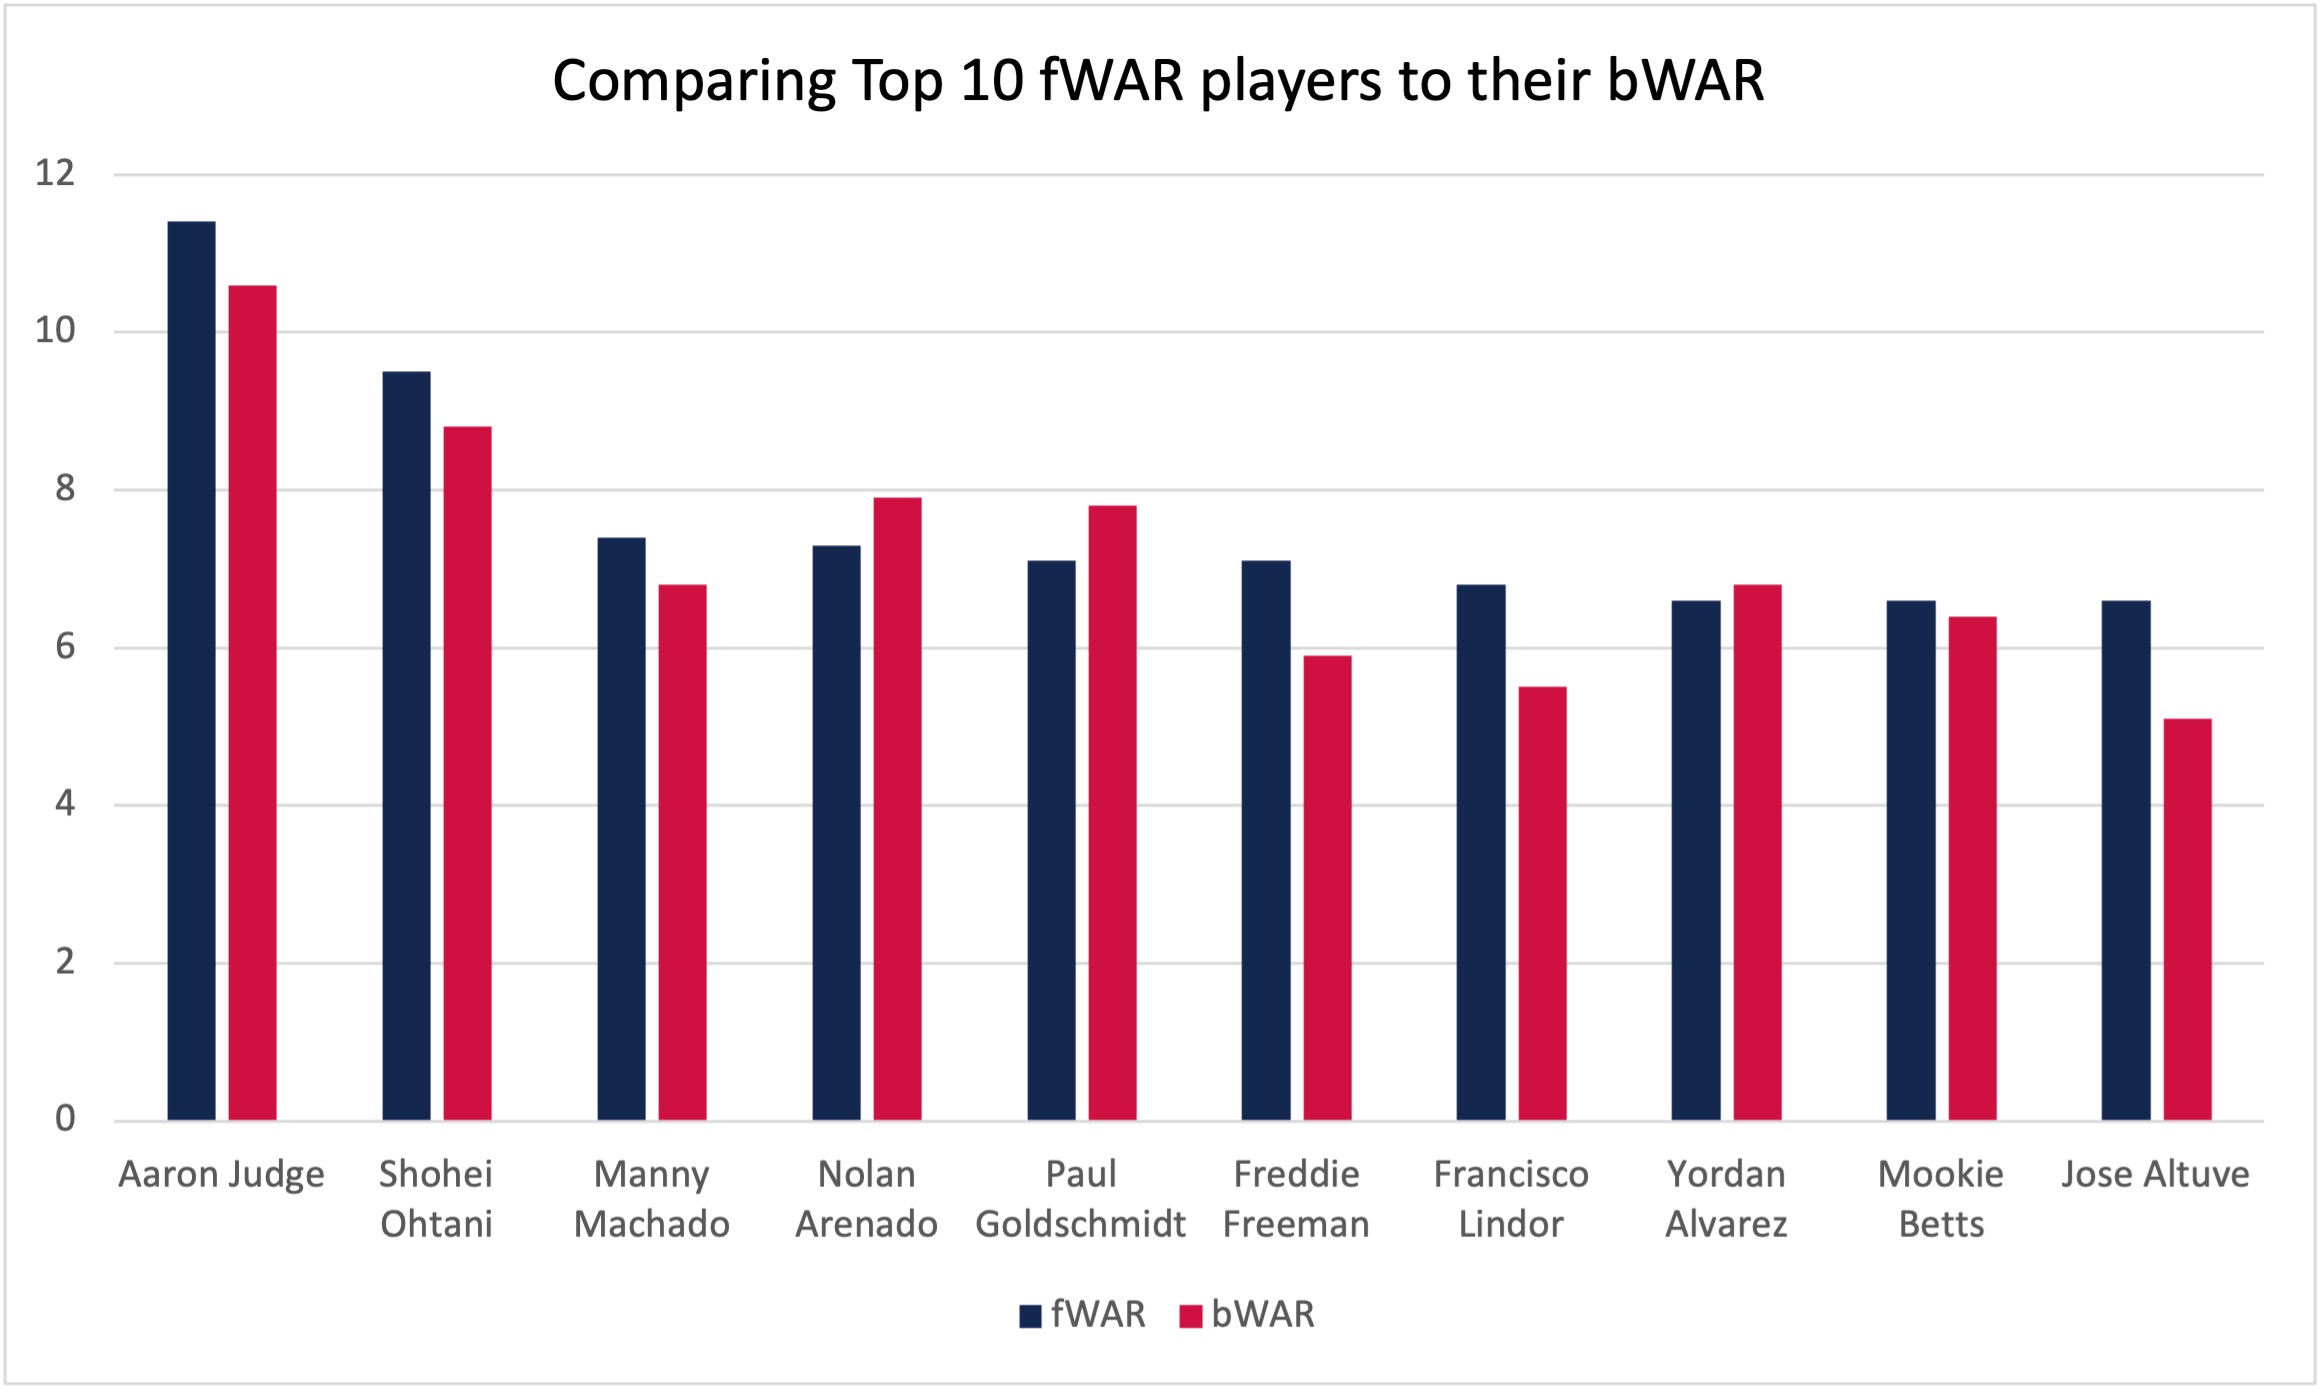
Figure 1: Data via Fangraphs, Baseball-Reference
For example, let’s take a look at Manny Machado. Manny Machado was one of the most valuable players in Major League Baseball (MLB) in 2022 and helped lead the Padres on their postseason run. He hit 32 homers and had a .382 wOBA (weighted on base average; essentially OBP but extra base hits receive extra weight). Fangraphs has him at 7.4 fWAR, which was 2nd overall for position players, whereas Baseball-Reference has him at 6.8 bWAR, which was 7th overall for position players. Manny Machado’s raw stats didn’t change from 2022, but valuing defensive play is largely the difference between fWAR and bWAR calculations. I will share more on this below to help clarify these distinct calculations.
Calculation WAR for Position Players
WAR is a comprehensive metric, including almost every statistic used to mark a player’s performance. When computing the WAR for position players, both websites start with remarkably similar bases:
fWAR = (Batting runs + Base Running runs + Fielding runs + Positional Adjustment + League Adjustment + Replacement Runs) / (Runs per win)
bWAR = (Batting Runs + Base Running runs +/- Runs from GIDP + Fielding Runs + Positional Adjustment Runs + Replacement Level Runs) / (Runs per win)
The major difference between fWAR and bWAR comes from the measurement of fielding runs, which is the defensive output a player provides. Fangraphs uses a statistic called Ultimate Zone Rating (UZR), while Baseball-Reference uses a statistics called Defensive Runs Saved (DRS). The differences in these stats can lead to drastically different calculations in WAR for some position players.
Both UZR and DRS are similar to WAR in that a zero for these statistics is equivalent to average for the position. Anything above zero means the player added value defensively and anything below zero means they were a liability defensively for their team. Both formulas are very similar and attempt to quantify a run value for defensive plays made. For example, a routine fly ball hit to center field is likely caught 99% of the time. Therefore, if the center fielder makes that play, he receives 0.01 points to his score. If, however, he does not make the play, then you would subtract .99 points from his score. Where these statistics differ comes from how they calculate these percentages of balls in play. UZR takes into account 3 years of players’ data as well as MLB data to determine these percentages, whereas DRS uses essentially 1 year of data. Therefore, some rookies will have drastically different UZR and DRS stats.
Let’s look at some of the largest differences in fWAR and bWAR for position players. Figure 2 compares the five largest differences in positional player WAR for the 2022 season. The largest difference come from Taylor Walls, who had not played a full season prior to 2022. This would help explain why the difference is so large, as UZR did not have enough data and undervalued him relative to the DRS statistic.
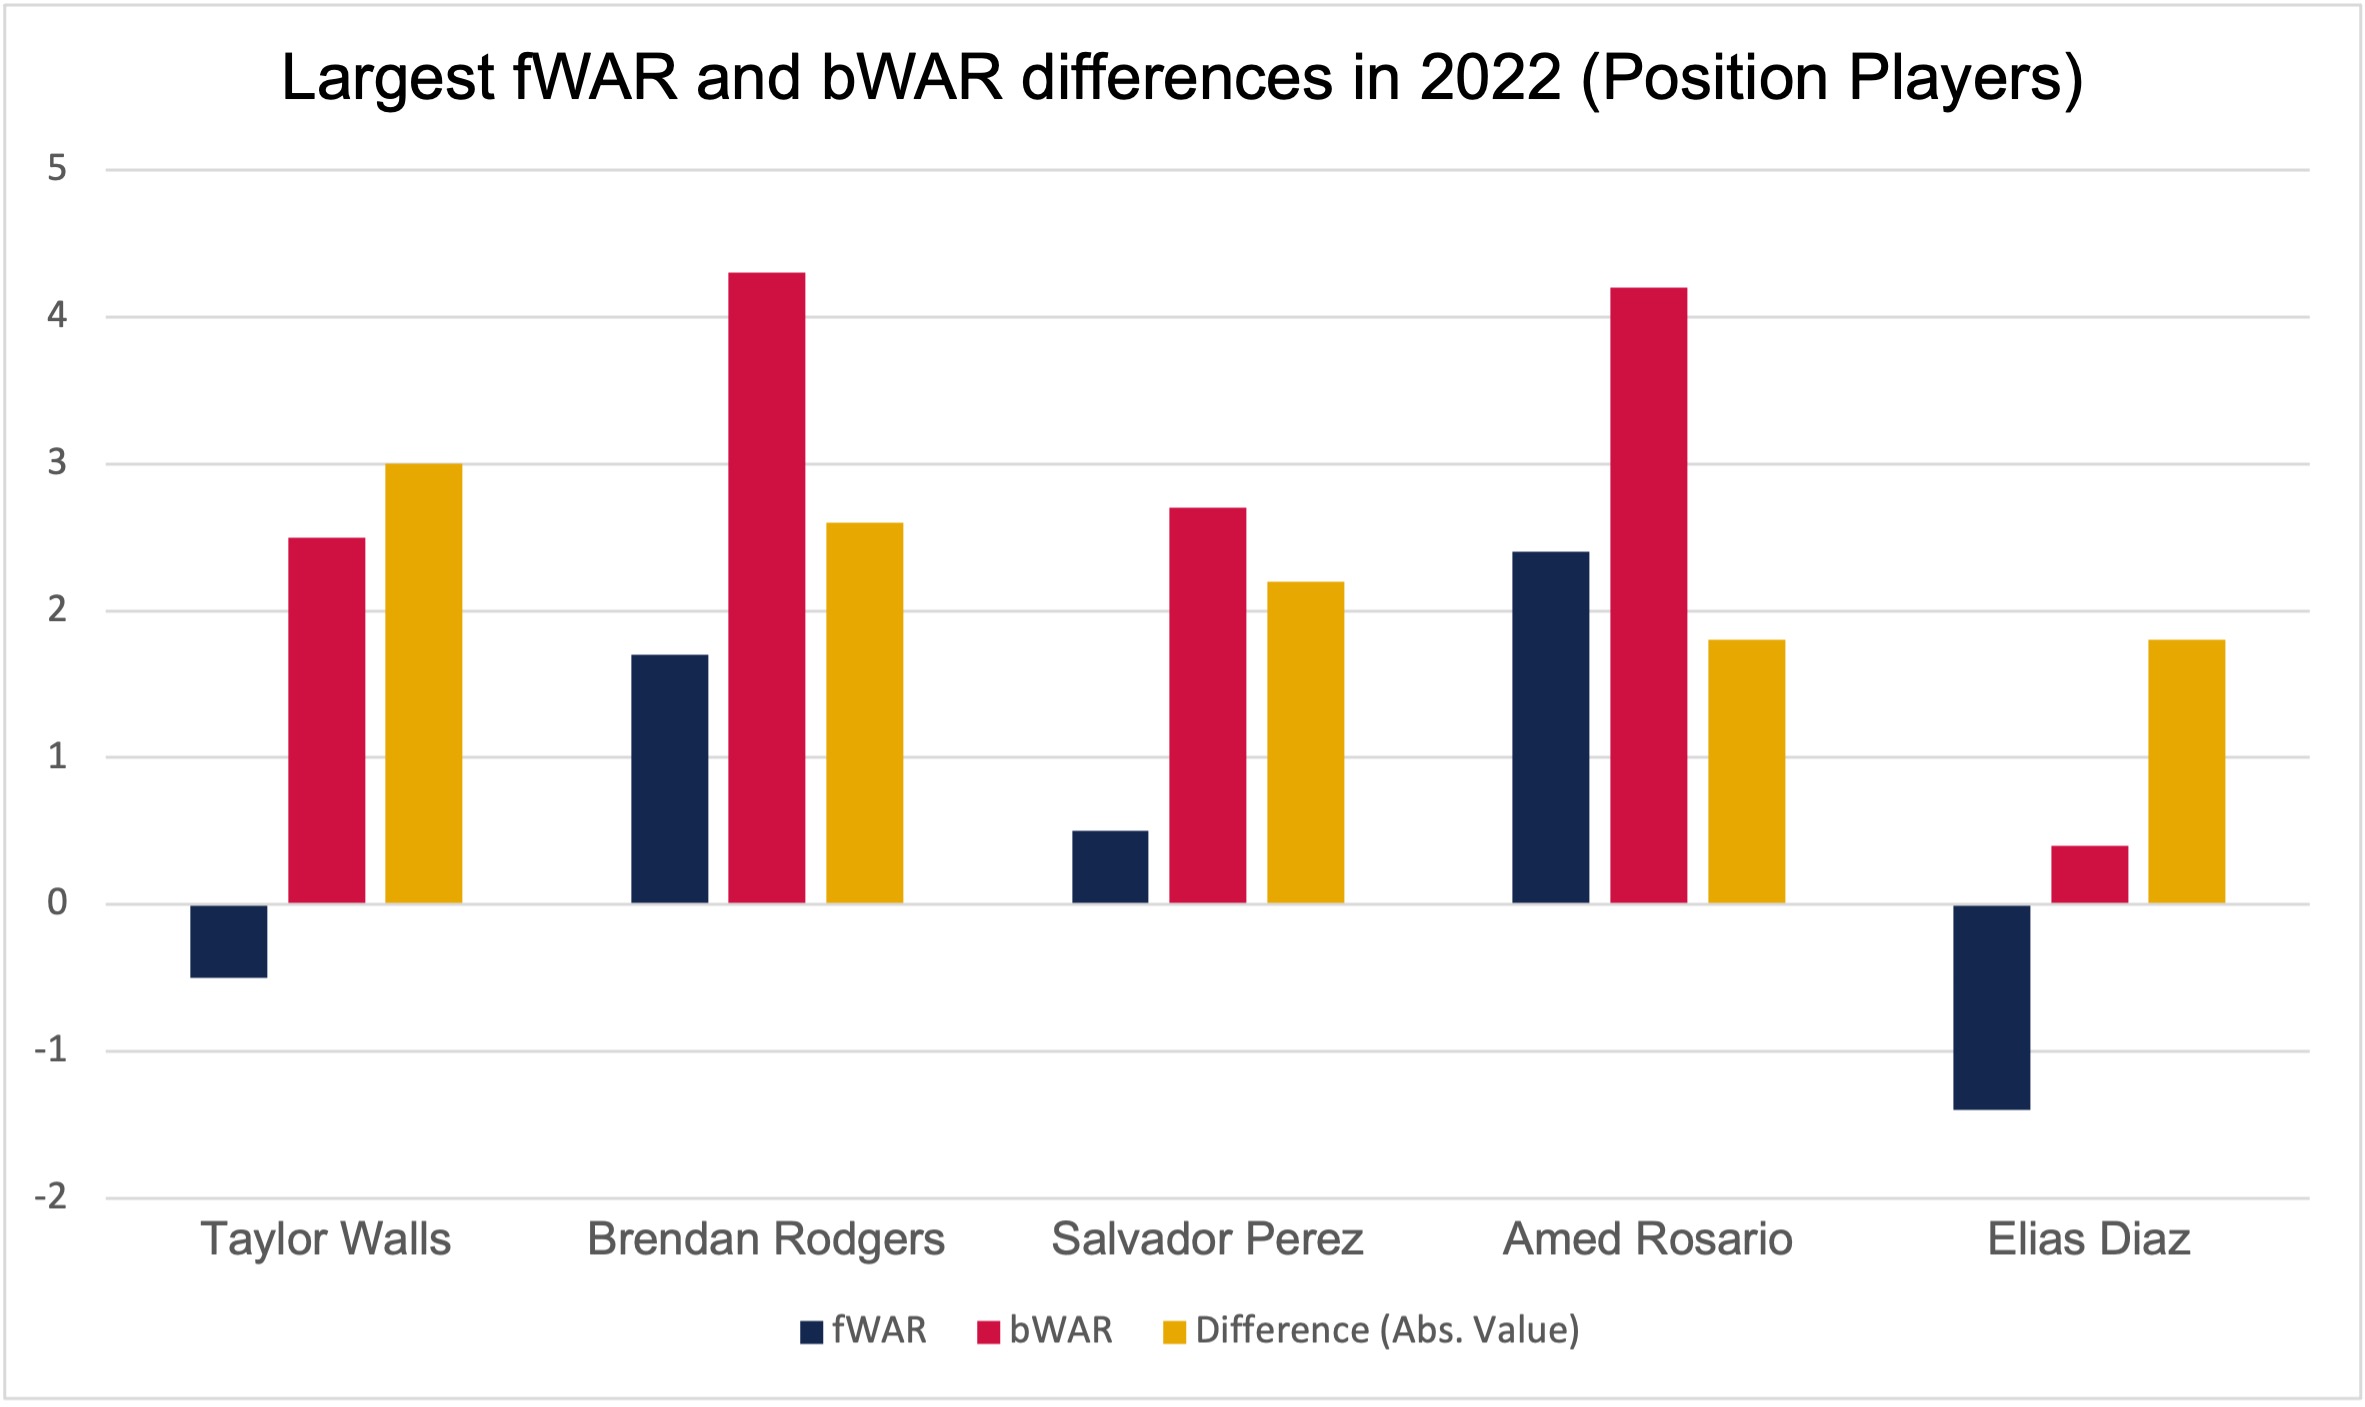
Figure 2: Data via Fangraphs, Baseball-Reference
Another example is Colorado Rockies shortstop Brendan Rodgers, a Gold-Glove-caliber shortstop with a .321 wOBA in 2022. Fangraphs and Baseball-Reference disagree on his total value; his fWAR for 2022 sits at 1.7, while his bWAR for 2022 sits at 4.3. That is the difference between an above-average player and close to an all-star caliber player. This difference equates to how these two sites value defense. Fangraphs, by using UZR, views Rodger’s defensive output as less impactful than Baseball-Reference, thus valuing him less.
Two other players on this graph, Salvador Perez and Elias Diaz, are both primary catchers. Measuring the defensive statistics of a catcher is significantly more complicated, as they are not treated defensively like a shortstop. Some notable catcher stats that are measured are stolen base runs saved, blocking statistics, as well as pitch framing. Pitch framing especially is a very new statistic and catchers that can frame balls into strikes are going to be more valuable for teams. This is the statistic that accounts for the large difference in fWAR and bWAR for Salvador Perez and Elias Diaz. They are both very poor pitch framers, and the difference in season-to-season data versus multiple seasons for UZR and DRS can help explain why bWAR looks more favorable for these players.
Similar to Rodgers, Cleveland Guardians’ shortstop Amed Rosario has a larger bWAR than fWAR. Rosario’s difference once again comes down to the different ways UZR and DRS calculate the defensive value of a player. DRS looks more favorably upon Rosario then UZR. Since the base calculations for the offensive output are similar, unless UZR and DRS drastically differ, fWAR and bWAR are unlikely to have significant differences for position players.
Calculating WAR for Pitchers
As opposed to positional players, Fangraphs and Baseball-Reference take drastically different steps in calculating the WAR of pitchers. It does not follow the formula for position players but does try to calculate the “wins” that a pitcher gives to their team. Instead, they use a “base” statistic to help calculate WAR. Fangraphs uses FIP, or fielding independent pitching, as its base for calculating pitchers' WAR, whereas Baseball-Reference focuses on Runs Allowed per 9 innings (RA9) for its base. To understand the fundamental differences between these statistics, let us investigate how they are calculated. (Per the Fangraphs.com website)
FIP = (13* HR + 3*(BB + HBP) – 2*K)/IP + FIP Constant (FIP Constant = constant to help re-center the league average FIP)
FIP is designed to measure a pitcher's value independent of the defense behind them. Since not every team has an elite defense, FIP tries to level the playing field and focus only on outcomes the pitcher can control. These stats are home runs, walks, strikeouts, and hit-by-pitches. By removing the somewhat randomness of balls put in play, we can see how the pitcher performs solely based on the outcomes he controls.
Runs Allowed per 9 innings (RA9) takes an entirely different approach. RA9 solely focuses on the runs a pitcher gives up, whether earned or unearned. The formula is far simpler then FIP and it is listed below. (Per the MLB.com website)
Runs allowed per 9 innings (RA9) = Runs/IP * 9
This brings the somewhat random defensive outcomes back into play and puts less weight into how a pitcher gets outs. To help explain this difference, here is an example directly from the Baseball-Reference website.
Situation #1, Pitcher A throws a perfect game with 20 strikeouts, Pitcher B throws a perfect game with no strikeouts.
Pitcher A à FIP = -1.40, RA = 0.00
Pitcher B à FIP = 3.20, RA = 0.00
Both pitchers threw a perfect game, but FIP would disagree on the value those pitchers provided for their teams.
While this is a drastic example, we can immediately see how this would impact fWAR and bWAR and how it can lead to drastic differences in how they evaluate pitchers' performance. fWAR would favor pitchers who get outs independent of defensive outcomes, i.e., strikeouts. In contrast, bWAR would favor pitchers who get outs in any way possible, such as groundball pitchers or pitchers with high-caliber defense behind them.
Refer to Figure 3, which highlights some of the most significant differences between fWAR and bWAR for pitchers from the 2022 season. Four out of the five largest differences in fWAR and bWAR for the 2022 season for all MLB players were pitchers.
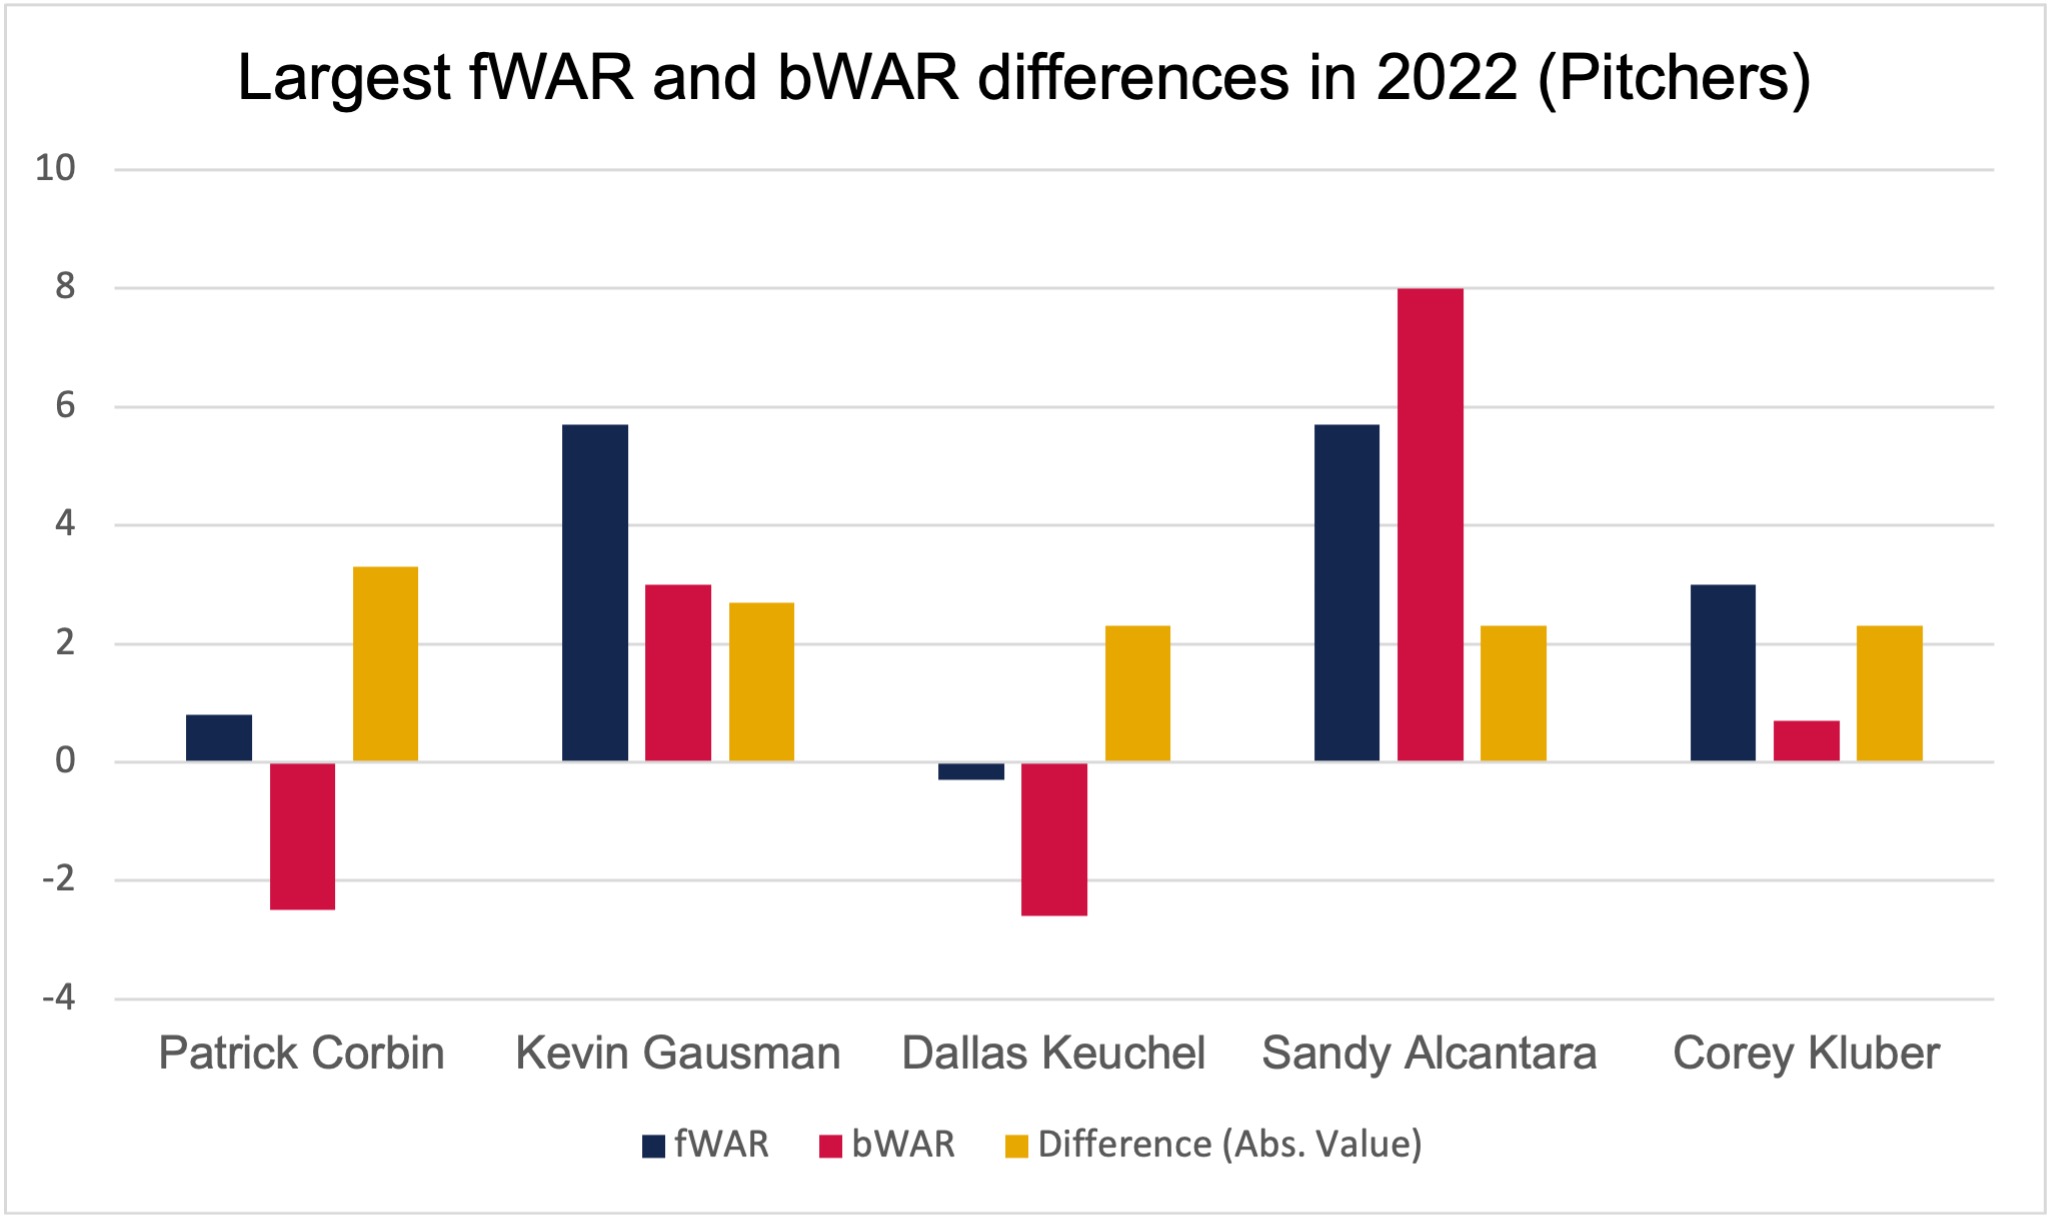
Figure 3: Data via Fangraphs and Baseball-Reference
Sandy Alcantara, the incumbent Cy Young Award winner, is only valued at 5.7 fWAR compared to 8.0 bWAR. Alcantara nearly threw 230 innings for the Marlins in 2022 but only had an 8.1 K/9 ratio. He heavily relied on groundball outs and double plays to keep his pitch count down, which allowed him to go deep into games and minimize arm fatigue. This helps explain why bWAR views Alcantara as the most valuable pitcher in the league, as he continually gets outs without relying too heavily on strikeouts.
Now compare the opposite, where fWAR is higher than bWAR, Kevin Gausman’s fWAR for 2022 was 5.7, but he only had a bWAR of 3.0. Fangraphs is much higher on him because of his higher strikeout ratio. Gausman averaged 2.5 more K/9 than Alcantara, earning him 10.6 K/9 for the 2022 season. However, Gausman allowed five more runs than Alcantara in 2022 in over 50 fewer innings pitched. While the differences in strikeouts alone don't completely explain the differences in fWAR and bWAR, it is a significant factor and something to consider when evaluating players' performance.
For another point of reference, let’s refer to the career WAR of some Hall of Famers. This helps determine whether the differences in calculations for fWAR and bWAR equate out over the entire career of a player. Figure 4 contains some players I view as “no-doubt” Hall of Famers, all of which have racked up significant WAR over their careers.
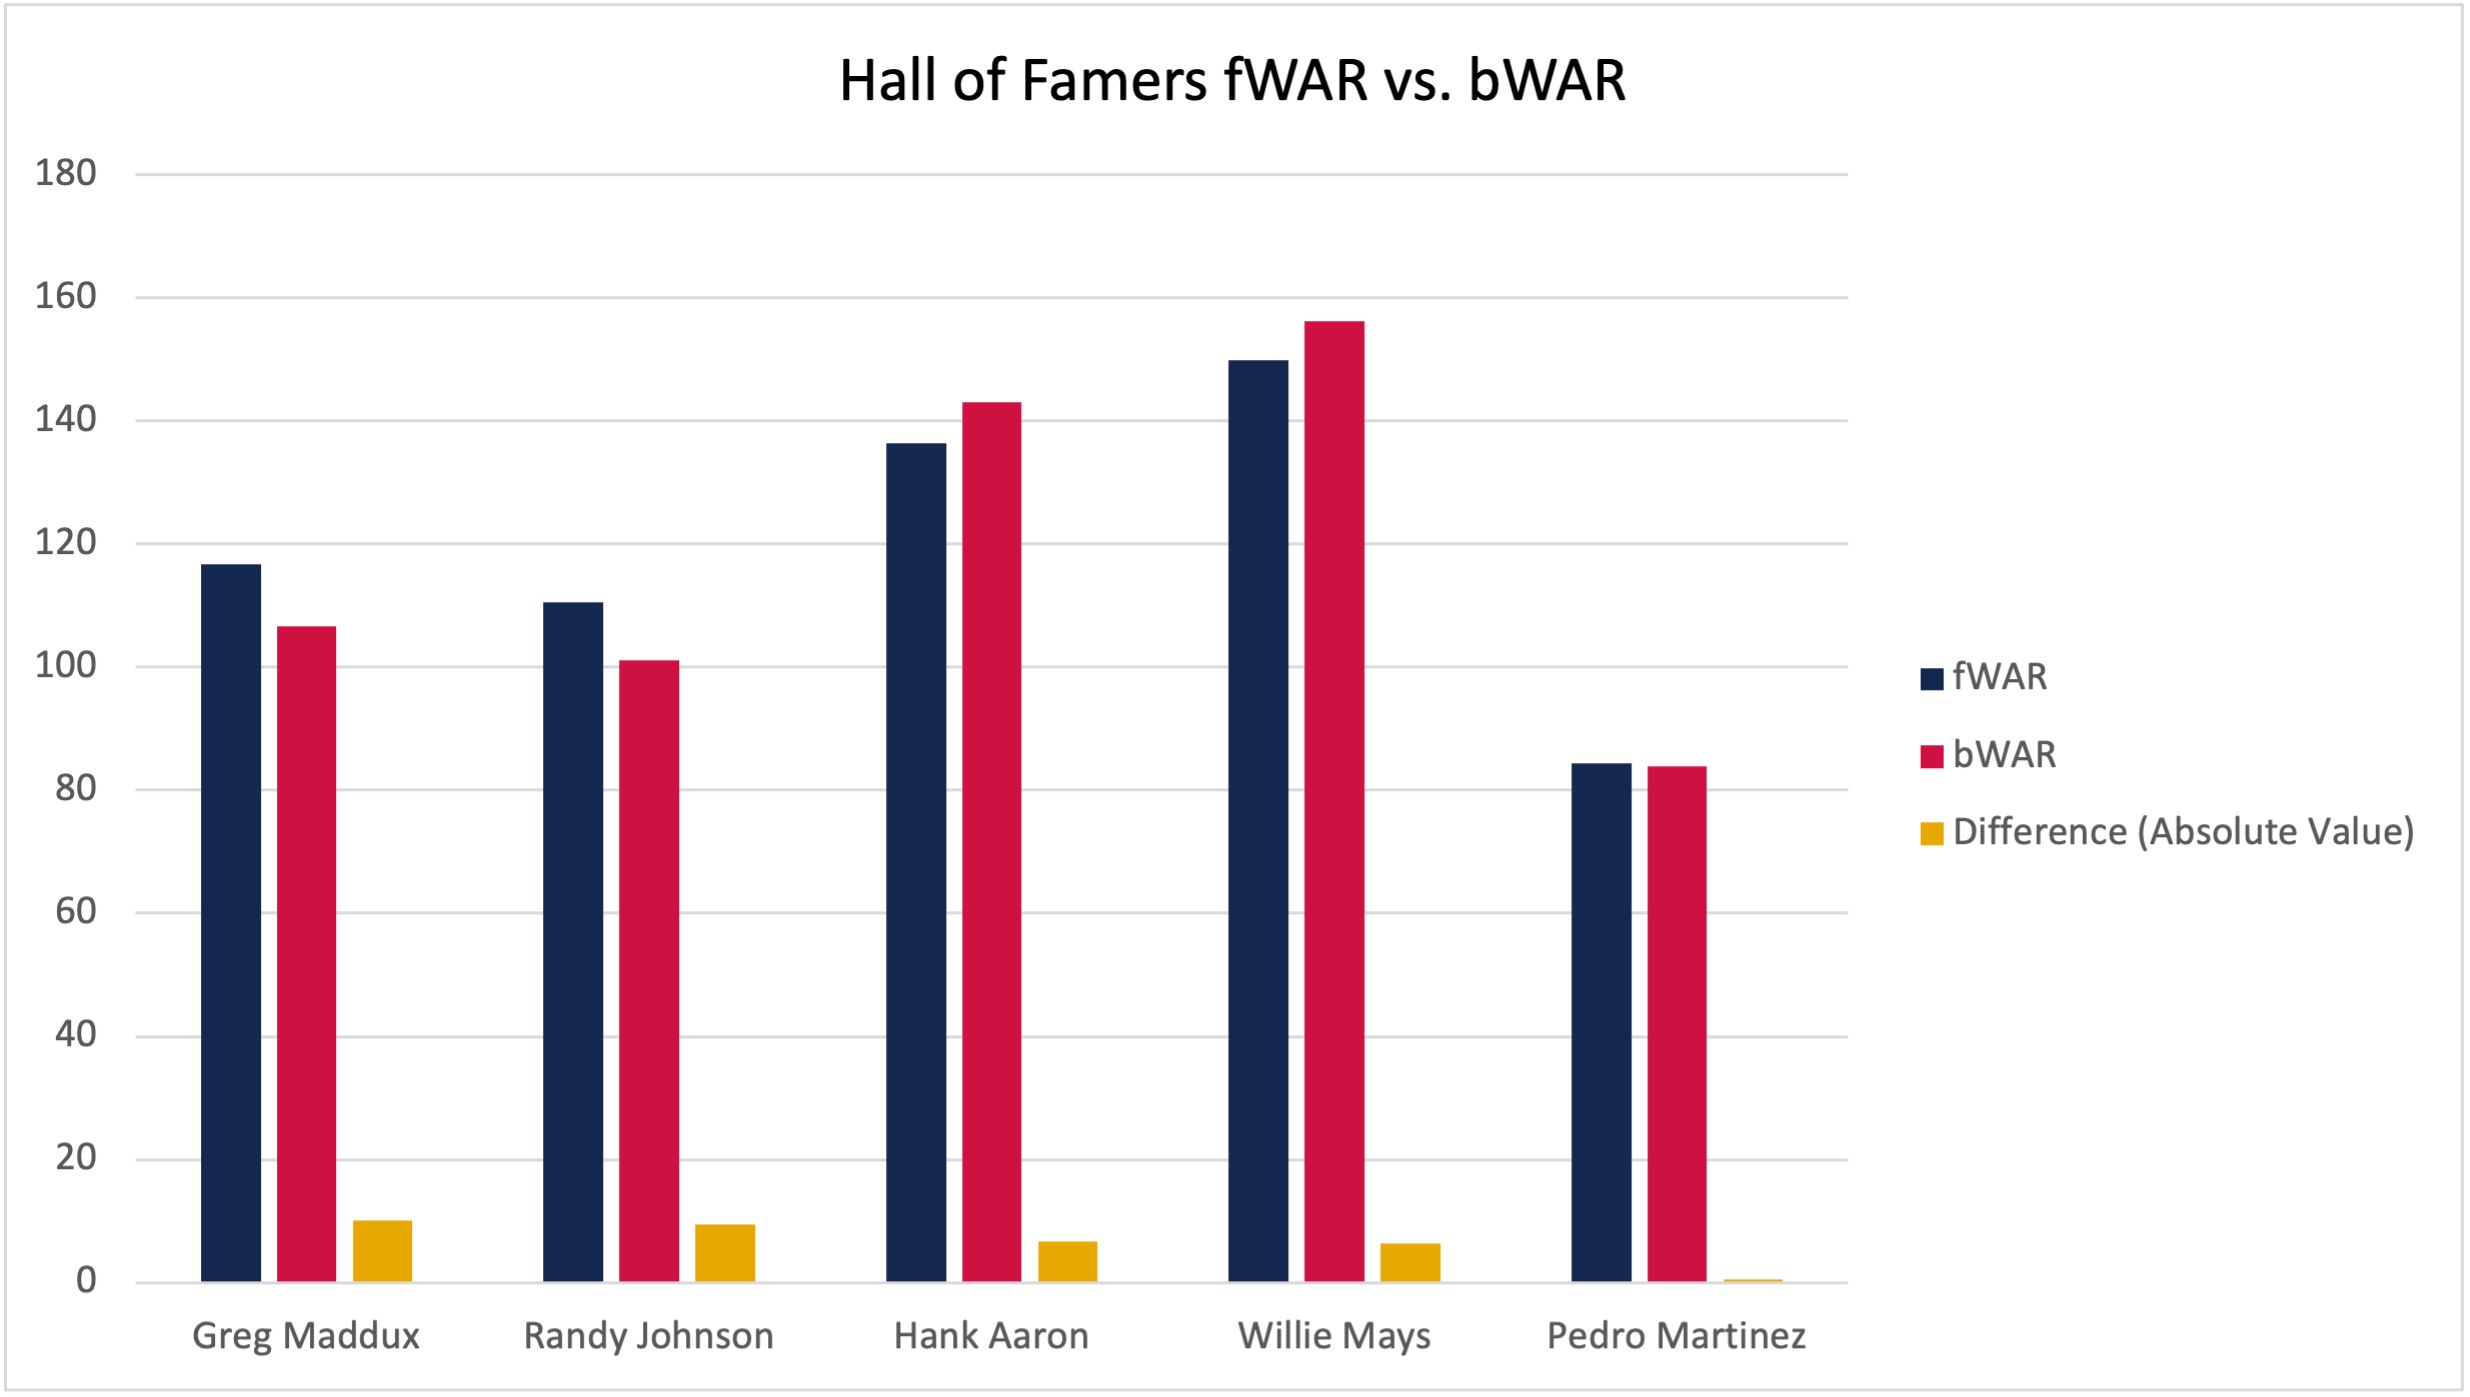
Figure 4: Data via Fangraphs, Baseball-Reference
Based on the career WAR of these Hall of Famers, it would appear, to a reasonable extent, that fWAR and bWAR will come relatively close to each other throughout a career. The biggest difference in fWAR and bWAR between these Hall of Famers comes from Greg Maddux. Maddux had a career ERA of 3.16 and a career FIP of 3.26. If you look at his prime, which was during his 11-year tenure with the Braves organization, his ERA was 2.63 and his FIP was 2.93. This was representative of one of the most dominant stretches for a pitcher in the 1990s. Fangraphs calculation says he tallied 116.7 fWAR in his career while Baseball-References’ calculation says he only tallied 106.6 bWAR. This is a difference of 10.1 WAR for his entire career. While this is a significant difference, it does not change how his career, or his Hall of Fame status, is viewed. When discussing the 1990s era of baseball, it is impossible to not mention the true dominance that Maddux had in an era when hitters were extremely successful.
For the position players on this graph, the difference in WAR is negligible. It can be accounted for the different baseball eras they played in and the much more difficult task of tracking advanced defensive metrics from those eras.
Conclusion
To summarize, there are noticeable differences in how fWAR and bWAR are calculated, particularly for pitching and defense. At the end of the day, there is not necessarily a correct answer for which WAR stat to use. Using fWAR or bWAR may lead you to value a particular player on different characteristics. Understanding what fWAR and bWAR do well, as well as the pitfalls of these statistics, is imperative to being a fan of what has become a sport that relies on advanced statistics more and more every year.
About the Author
Jack McLeod is a graduate student pursuing his M.B.A. with a concentration in Data Analytics. He graduated from Samford in May of 2022 with a degree in Economics and a concentration in Sports Analytics.
Email: jmcleod2@samford.edu
Twitter: @JackMac2k
LinkedIn