
The NBA MVP goes out to the most valuable player of every season. However, some view it as the award for the player with the best statistics, rather than the most valuable. However, value can be subjective in some ways, and it would be logical to assume that the player with the best statistics technically gives his team the most value. The logic behind the actual definition of the award is an entire debate in its own right. This past season the debate around the MVP race became quite toxic and controversial. Interesting questions arose from it however, like what makes someone an MVP, or which metrics matter and which don’t, amongst many others. As far as metrics go, I do think more traditional metrics like points per game are still extremely valuable. However, I think the advanced ones are a lot more fascinating, and often more helpful/insightful when gaging a player or team’s performance. That is why I set out to determine which advanced metrics are most correlated with team success, and therefore should not only be valued the most when voting on this award, but also be looked at more closely by teams when evaluating players.
Method
Instead of looking at individual player metrics on their own to try and find the correlation with team success, I will be taking multiple advanced metrics and calculating them for the entire team. This will make things much easier when justifying the correlation with wins(team success). As I mentioned earlier, I will only be using what are known as “advanced” metrics. I will primarily be using ones that try to encapsulate every aspect of a player's performance, since the MVP award is supposed to take in every aspect of a player’s game. I will be using many of the more commonly known ones, as well as some lesser known ones to have a diverse set of metrics.
Metrics Being Used
- Win Shares: Calculated using player, team and league-wide statistics to determine approximately how many wins a player has contributed to his team.
- Value Over Replacement Player(VORP): A box score estimate of the points per 100 TEAM possessions that a player contributed above a replacement level player, translated to an average team and proportional to an 82 game season.
- Player Efficiency Rating(PER): Sums up a player's positive/negative accomplishments, into a per minute rating of a player's performance.
- Player Impact Estimate(PIE): Shows what percentage of game events a player/team achieves.
- Floor Impact Counter(FIC): Encompass all aspects of the box score into a single statistic. Intended to be similar to other efficiency stats, but assists, shot creation and offensive rebounding are given greater importance.
- Win Probability Added(WPA): Utilizes box score stats to rank player contributions that are weighted to give more credit to clutch shots and pace of game. It is the win probability added/subtracted due to made/missed shots, getting fouled, made/missed free throws, and turning over the ball, all while being weighted based on the particular situation of a game.
- Kitchen Sink Win Probability Added(kWPA): Quantifies win probability contributions for box score stats at the player level. It is the sum of the previously mentioned WPA, and the Win Probability Added due to rebounds, assists, blocks, and steals.
- Approximate Value(AV): An integer estimate of a player's value. It distinguishes between good seasons, average seasons, and poor seasons.
Rules
I will be taking these metrics, calculating the total/average for the entire team during the regular season, and calculating the correlation coefficient with team wins for the entire league. This will tell us which metrics are most heavily correlated with team success, and should therefore be looked at more closely when teams are evaluating player performance, as well as for determining who should win awards like the MVP. To try to avoid stat inflation(or deflation) between different eras of the game, as well as to keep it as relevant to today’s game as possible, I will only be using metrics dating back to the 2015-2016 season. I chose this season because this is when the three point revolution truly began to explode, and guys started taking/making more three point shots than ever before. Three point shots were becoming a more common trend in the years leading up that season, but this is the year in which it truly first exploded. I will also be excluding the 2019-2020 season, as this was the “bubble” season. The reason I won’t be including this one is because not every team was invited to play in the NBA bubble in Orlando, and therefore many teams ended up playing a different amount of games that season, which skews the numbers. That leaves us with seven seasons of data to look at.
Calculation
Since these advanced metrics are traditionally used for individual player analysis, I will have to calculate them for the entire team. For win shares, VORP, FIC, WPA, and kWPA it is as simple as adding up every player’s total on each team for each metric. For PIE, the team score is already listed on the official NBA website. For AV, I simply calculate it using these formulas:
Credits Formula = (Points)+(Rebounds)+(Assists)+(Steal)+(Blocks)-(Field Goals Missed)-(Free Throws Missed)-(Turnovers)
AV Formula = (Credits^(3/4) )/21
It is worth mentioning that there are a significant number of metrics that use extremely similar calculations as AV, but I decided to leave them out of this project, as they either didn’t provide as much value as AV, or had significantly less correlation. For PER, I had to do something a little bit different. I can’t just add up the totals for every player on each team, as it is an average metric, not a total one. For example, in the 2022-2023 season, Justin Champagnie had a PER of 28.9 for the Toronto Raptors. 28.9 is very high for this metric. However, simply using that number without taking into consideration that he only played 11 minutes for the entire season would be completely unfair. To account for this, and due to the fact that PER is a per minute rating, I will be dividing how many minutes each player played by the total amount of minutes that team played for the season, and multiplying it by their PER value, and then adding up those numbers for each team. This way the higher portion of minutes a player plays for their team, the more of his PER value he gets to keep when calculating the team’s total PER. For Justin Champagnie this past season, you would use this calculation to figure out how much of his PER gets contributed to the team total: (11/3961) x 28.9 = 0.08025751. 0.0825751 is what is added to the team PER total. To put it all together, I will find the average correlation coefficient of each metric with team success(wins) over the seven seasons I’m evaluating. Then, we’ll take a look at where each metric ranks compared to one another, and therefore which ones should perhaps be given more weight when considering who to vote for in an MVP race, or for when front offices are evaluating players.
My Prediction
Out of all the advanced metrics I used for this research, I predicted that win shares would have the highest correlation with team success(wins). That is the obvious pick, as the whole purpose of the metric itself is to calculate how many wins a player is contributing to a team. A team’s win share total is supposed to be very close to the actual amount of games they win.
Data
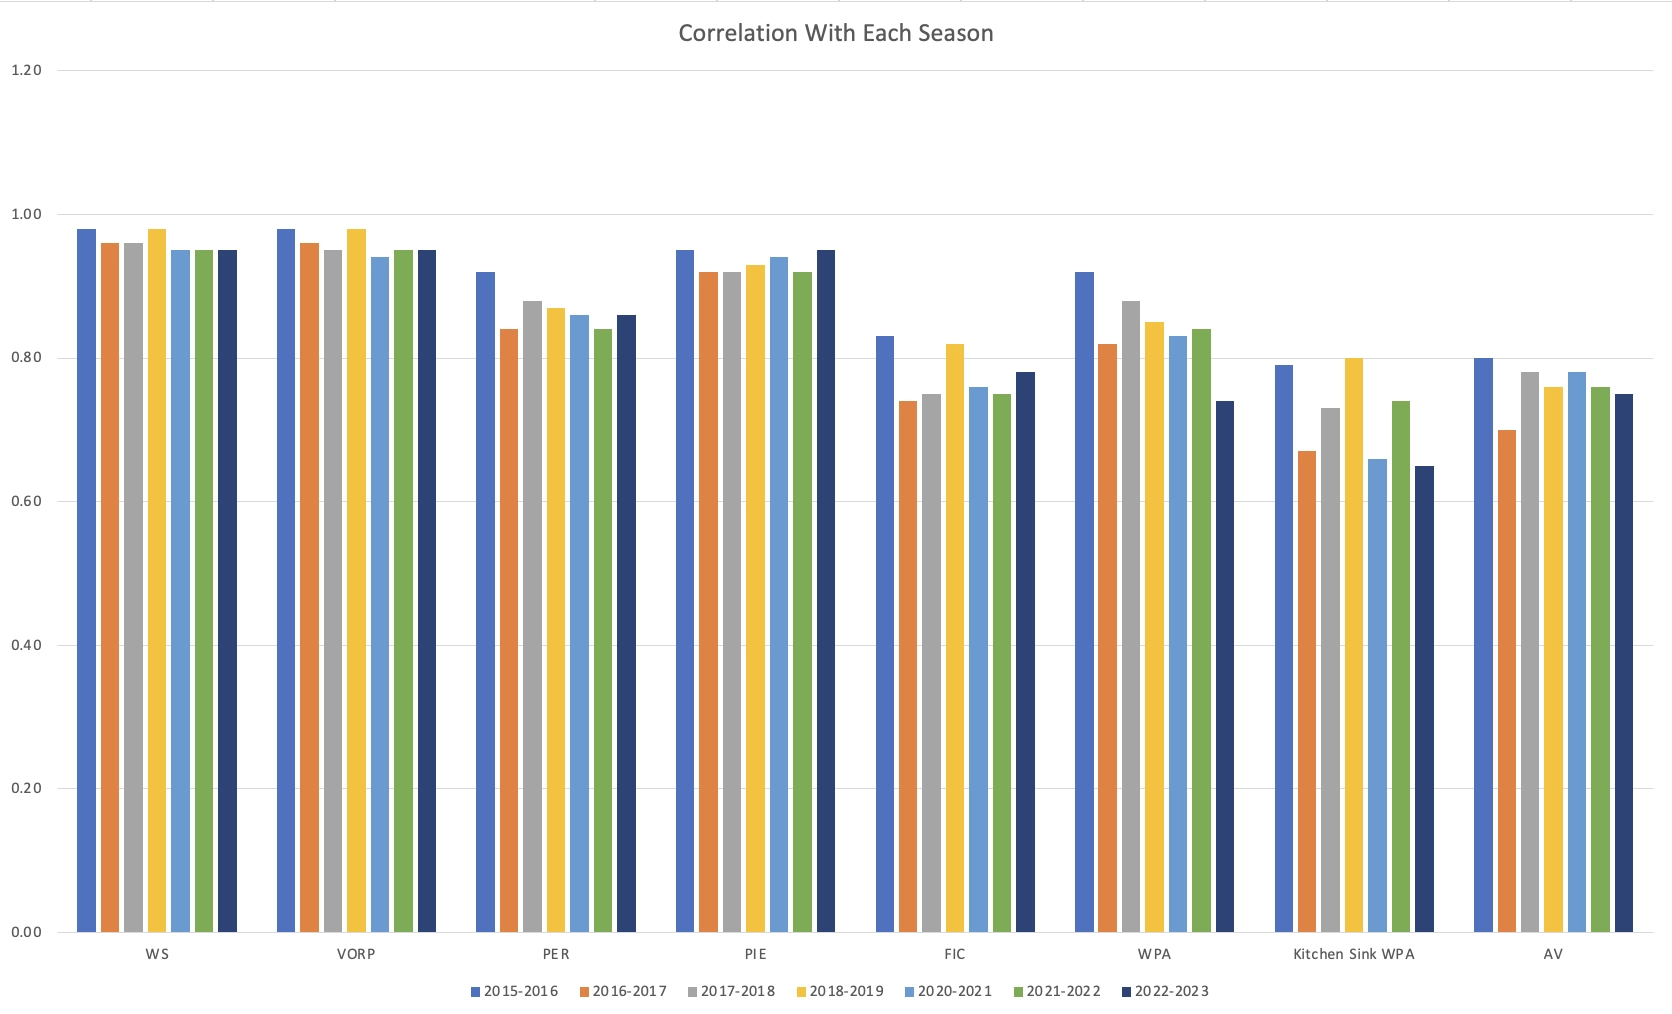
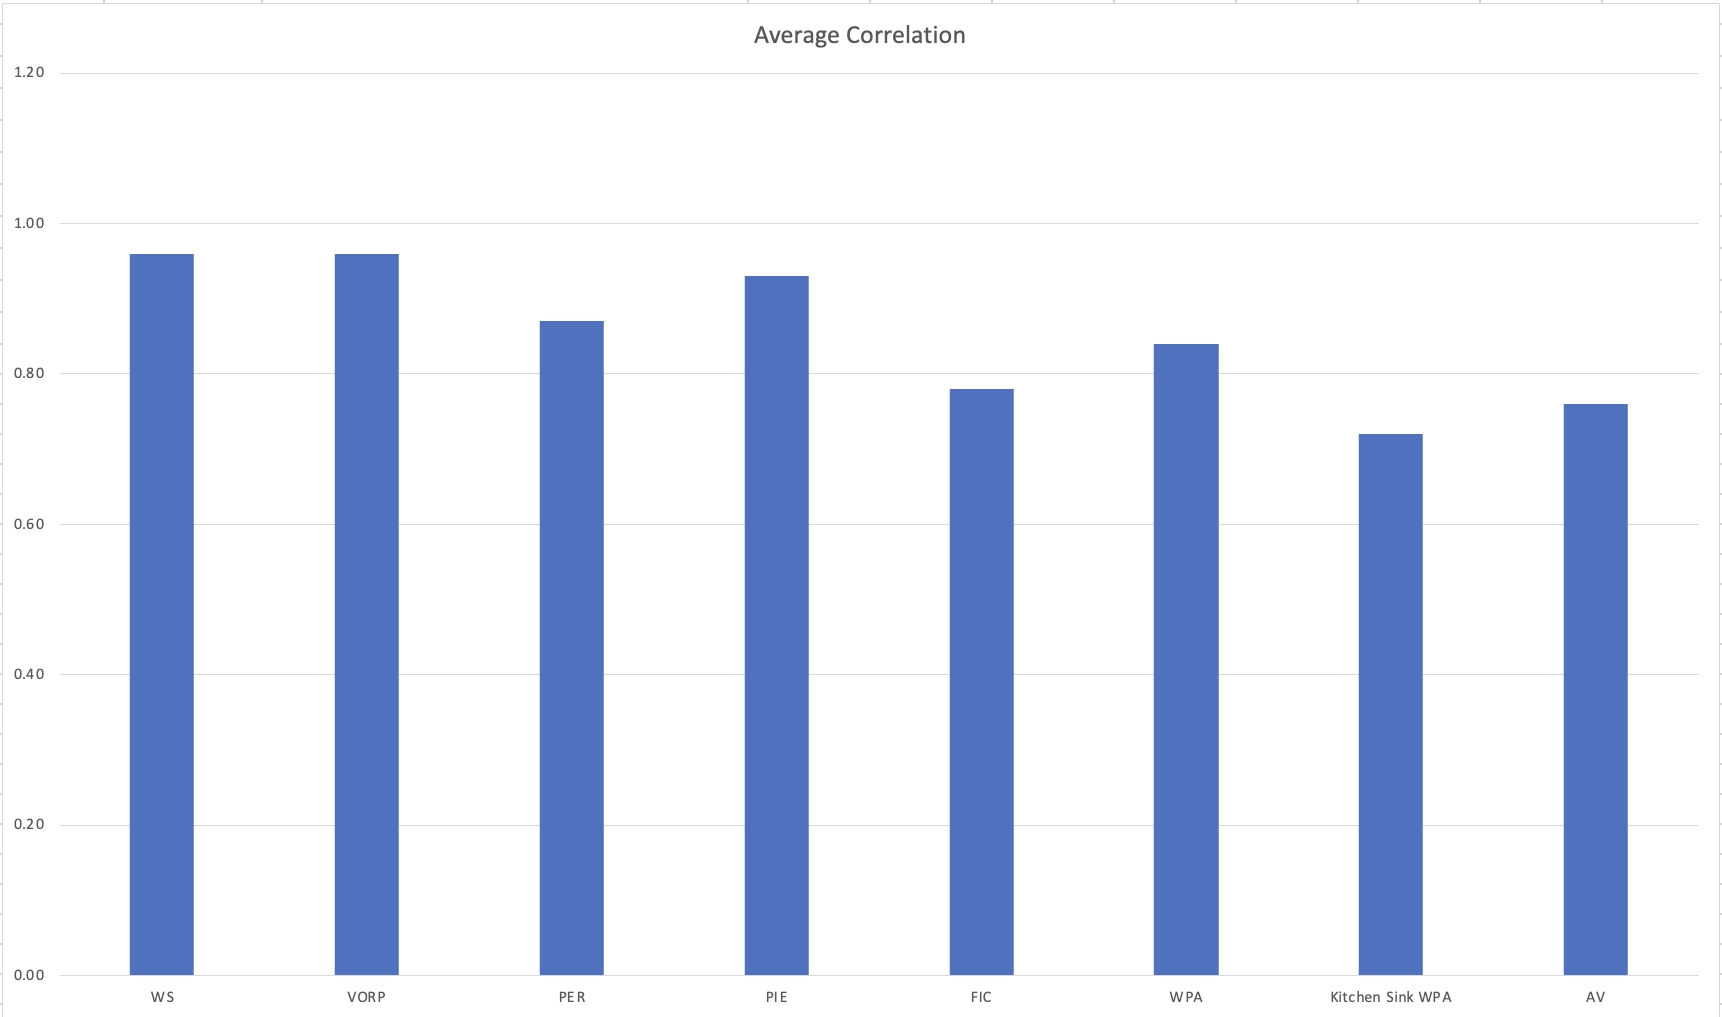
Results
My prediction about win shares having the highest correlation with team success(wins) was true. Interestingly enough, it ended up being tied for first with VORP, which was certainly surprising, as I expected win shares to run away with first place. I was surprised by how well all of these metrics correlated with team success. Even the metrics with the lowest correlation in the group still performed fairly well(in the low to mid 0.7s). Most of the metrics were fairly consistent as well. The ones with the most variation were both of the WPA metrics, however they were still pretty consistent all things considered. Out of the eight metrics I used, three stood out as the ones I believe should be valued most when it comes to the MVP award, as well as for general player evaluation: Win Shares, Value Over Replacement Player(VORP), and Player Impact Estimate(PIE). Win shares and VORP had an average correlation coefficient with wins of 0.96, and PIE had an average correlation coefficient with wins of 0.93. The next closest one after these three was Player Efficiency Rating(PER) with a coefficient of 0.87. This is still extremely impressive, and using this metric when evaluating players would most likely be quite insightful. However, for the purposes of this project, I can only single out a handful of metrics.
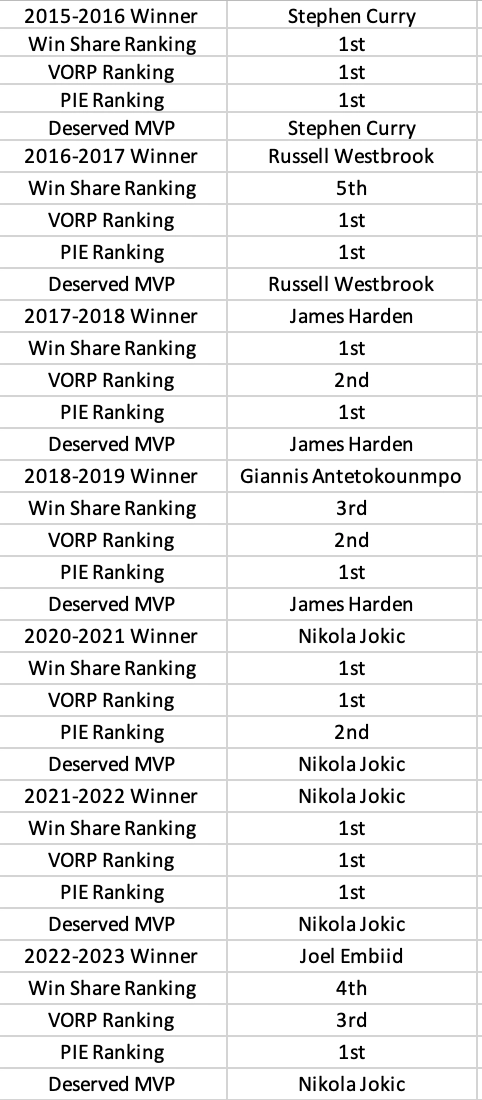
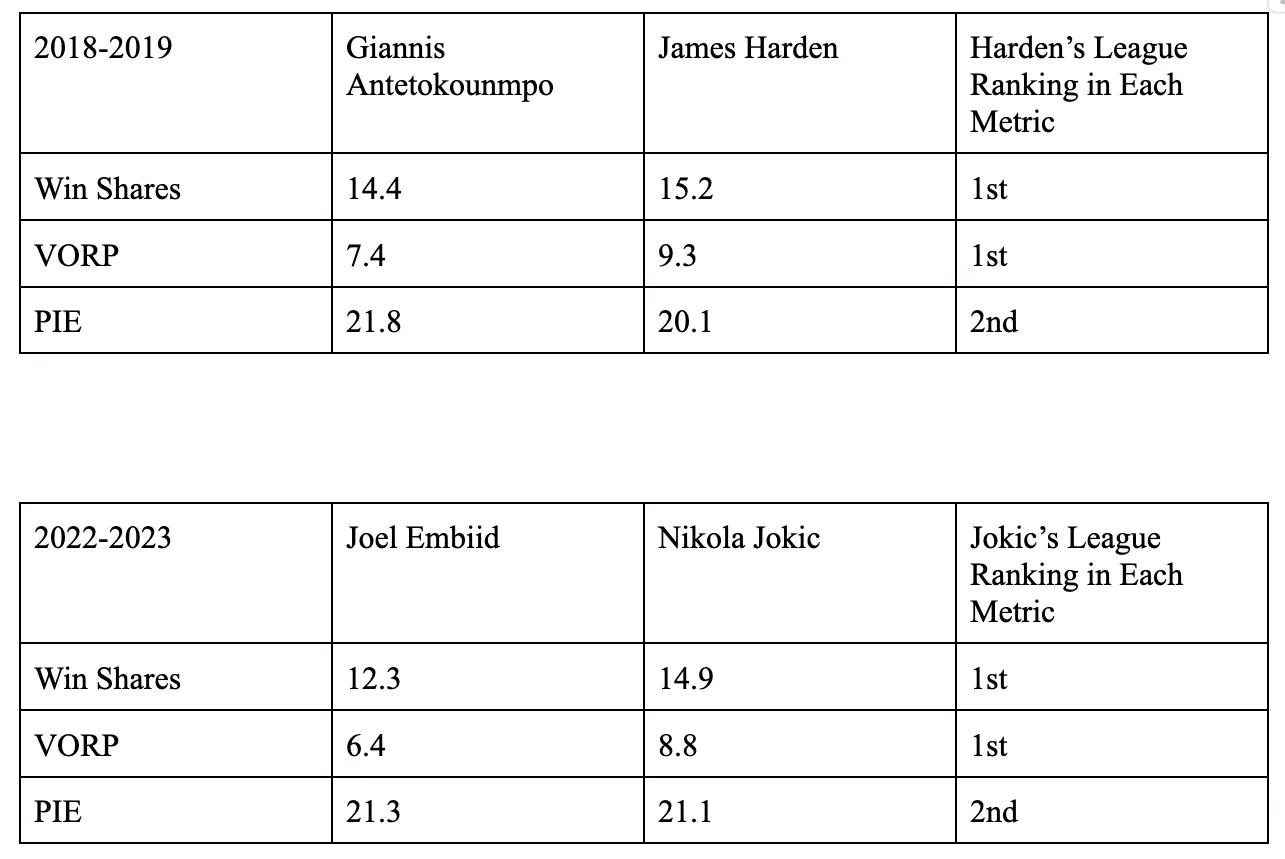
MVP Winners
To see how well the voters have done with selecting the MVP each year, we’ll be taking a look at where each MVP winner has finished in these three categories, and whether or not another player was able to finish higher in the league rankings for these metrics, therefore possibly deserving the award more than the guy who actually won it.
Conclusion
Seeing that the correlation coefficient with wins for every advanced metric observed, on average, didn’t go below 0.72, I think it is fair to say that any of these metrics would be very serviceable when evaluating players. I do think the three that I highlighted, as well as PER, might be slightly more valuable due to a higher correlation with winning. I believe that taking into account both advanced metrics, as well as more traditional stats like PPG, RPG, and APG is the best way to go about evaluating NBA players.
About the Author
Brady Goodman is a senior at Samford University. He is a part of the sports analytics program.
Email: bgoodman@samford.edu
Twitter: b_good_8