Introduction
Postseason baseball is here! That means the champion of the league will soon be crowned in the World Series. I love baseball, but I understand why some people would think that the regular season goes on a bit too long, and watching any random regular season game can often feel a bit boring or pointless. However, postseason baseball is a completely different beast. Every game is worth watching, as the outcome of the team's entire seasons are on the line almost every night. With great postseason baseball comes great postseason performances, and believe me there have been quite a few of them. The World Series is the game’s biggest stage, and I will be determining the 10 best hitting and pitching performances in World Series history.
Guidelines
Baseball is one of the oldest professional sports in this country, and with that the World Series has been going on for an extremely long time. The format of the entire postseason has changed quite a bit, but the World Series has always been there. The World Series MVP award on the other hand has only been around since 1955. So, that is why I will be considering any performance from the 1955 World Series or later to be eligible for these rankings. This makes it so that I don’t have to cross over too many different generations of the game, to make the rankings more balanced.
Metrics
Advanced metrics and baseball have become known as a match made in heaven, as there are an almost endless amount of metrics that can be used/researched to evaluate America’s national pastime. Strangely enough, advanced metrics are significantly harder to find for just the postseason and/or World Series. Luckily there are still a few advanced metrics to look at for the World Series. In addition to many of the more traditional baseball metrics like hits, home runs, strikeouts, etc… I will also be looking at win probability added(WPA), and championship win probability added(cWPA). WPA shows the change in probability caused by a player during games, given average teams. For reference, A WPA of 1.2 would indicate 1.2 wins added for a team by that player’s performance alone. WPA shows the change in probability because of a player’s performance through additional games won/lost, whereas cWPA shows the actual percentage change in probability, given average teams, due to a player’s performance. What makes this metric so interesting is that a A change of 100% would indicate one world series win added due to a player’s performance. This is truly unique, as very few metrics are able to measure how a single player impacts a team’s chances of winning a championship so precisely. So, a cWPA value of 42.4% would mean that a team’s chances of winning a world series go up by 42.4% due to the performance of that player alone. It is also worth mentioning that both WPA and cWPA are calculated separately for hitters and pitchers. In my opinion this is a very positive thing, because calculating value for pitching and hitting in the exact same way would seem a bit unfair, as value is created differently for both facets of the game. I will also take the urgency/closeness of both the series and the games into consideration as well. What this boils down to is essentially clutchness(in my opinion of course). This also lends itself to the overall legacy of the performance over time. Given all of this, it is obvious to assume that player’s on the teams that won the series are going to be heavily favored in these rankings, as the performances actually led to a championship being won. That being said, any performance is able to make this list if it is good enough. It will be up to me to balance the statistical performances, using both advanced and traditional metrics, and what the performance actually meant in the context of certain individual games, and of course the series as a whole. Let’s start with the pitchers:
#10
2001 Randy Johnson(3-0 W-L, 1.04 ERA, 0.69 WHIP, 17.1 innings, 19 Ks, 2 games started(3 games total), 1 complete game shutout, 0.76 WPA, 31.0% cWPA; World Series Winner/World Series MVP): Three pitching wins in a single World Series is quite impressive, especially when you factor in that this series went seven games, and the Diamondbacks were heavy underdogs in this fight. The innings, strikeouts, and ERA are all exceptional, while the WHIP and win total are excellent. The game two complete game shutout looks incredibly nice as well. The reason this is only at number 10 is because both of Johnson’s WPA totals are a little lower than most of the other performances ahead of it. It is worth mentioning that both his WPA and cWPA are still fantastic regardless. Interestingly enough, Johnson was named co World Series MVP with fellow star pitcher Curt Schilling, who was only a couple spots away from also making this list.#9
1955 Johnny Podres(2-0 W-L, 1.00 ERA, 1.06 WHIP, 18.0 innings, 10 Ks, 2 games started, 2 complete games(1 complete game shutout), 0.73 WPA, 67.3% cWPA; World Series Winner/World Series MVP): The first guy to ever be named World Series MVP set the bar extremely high for everyone else to follow. This series took place back when complete games from starting pitchers were significantly more common, as can be seen by his two complete games in this series alone. One of these was a complete game shutout to win game seven of the series. Podres’ put up an extremely impressive cWPA of 67.3%, which ranks as the 7th best in a single World Series since 1955. The reason this performance isn’t higher on this list is because his WPA is lower than many of the other performances on this list, and his strikeout total is quite weak(this most likely has to do with the lower strikeout rates of the era)#8
2003 Josh Beckett(1-1 W-L, 1.10 ERA, 0.80 WHIP, 16.1 innings, 19 Ks, 2 games started, 1 complete game shutout, 0.93 WPA, 45.5% cWPA; World Series Winner/World Series MVP): This is the postseason where Beckett established himself as a premier postseason performer, and this was on full display during the World Series. His WHIP and WPA are fairly noteworthy, and a complete game shutout to close out the series helps boost his performance as well. The ERA partially holds this one back from being any higher. It is still an amazing ERA, but it is just okay in the context of this list. The main part of his performance that is holding it back is the cWPA of 45.5%, which is the 2nd lowest on this list.#7
1971 Steve Blass(2-0 W-L, 1.00 ERA, 0.61 WHIP, 18.0 innings, 13 Ks, 2 games started, 2 complete games, 0.98 WPA, 73.3% cWPA; World Series Winner): Despite being the only guy on this list to not win a World Series MVP for his performance, his contributions can’t possibly be understated. In a series that went to seven games, the Pirates needed both of the games Blass started in order to win the title. Both games he pitched were 1 run complete games that the Pirates won, including the deciding game seven, which was a nail biting 2-1 victory over the Orioles. His miniscule WHIP of 0.61 is incredible to go with extremely impressive WPA numbers. The strikeout total isn’t great, but it’s definitely not awful when you take into consideration that this took place during the early 1970s. A complete game shutout would’ve been a nice bonus to help boost this performance. The main factor keeping this one at #7 is the fact that he only pitched 18 innings. This is enough to get a spot on this list if a pitcher makes the most of those innings(which he did), but all of the performances above this one have a higher innings total. This is also the main reason why there aren’t any relief pitcher performances on this list, as it is harder to accrue higher traditional and advanced metrics with a more limited amount of innings.#6
1967 Bob Gibson(3-0 W-L, 1.00 ERA, 0.70 WHIP, 27.0 innings, 26 Ks, 3 games started, 3 complete games(1 complete game shutout), 0.99 WPA, 46.9% cWPA; World Series Winner/World Series MVP): As far as traditional stats go, you could argue this performance to be the best. It also does a great job of highlighting a key difference in the game of baseball today vs back then; starters pitched so much further into games back then. Three complete games in the span of a seven game series is insane. Especially when you add in the fact that Gibson won all three of those starts, had an extremely high strikeout total, and an incredibly low WHIP to go along with only giving up one run per game. Gibson’s WPA is very strong as well, but his cWPA is what holds him back. Only two other performances on this list have a lower cWPA, and all of the performances in front of him have a significantly higher cWPA. But, it is hard not to admire how much of a workhorse Gibson was for this series.#5
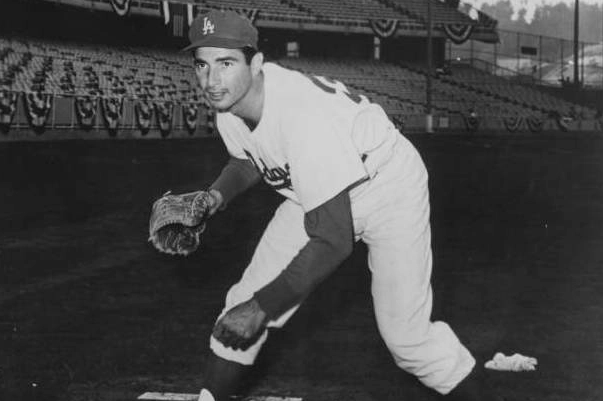
1965 Sandy Koufax(2-1 W-L, 0.38 ERA, 0.75 WHIP, 24.0 innings, 29 Ks, 3 games started, 2 complete game shutouts, 0.81 WPA, 70.5% cWPA; World Series Winner/World Series MVP): On the surface this performance is quite similar to the previous one. Both have a high innings and strikeout total to go along with extremely impressive WHIPs. This one gets the nod because Koufax managed to throw two complete game shutouts vs Gibson’s one. Koufax also threw one of his shutouts in game seven to win the series. His ERA is a little lower than Gibson’s as well. While Gibson had a slightly higher WPA, Koufax’s cWPA of 70.5% soars above Gibson’s, and is arguably the main factor to put him ahead. A cWPA of 70.5% is good enough for the 6th best of all time in the era being evaluated.#4
1957 Lew Burdette(3-0 W-L, 0.67 ERA, 0.93 WHIP, 27.0 innings, 13 Ks, 3 games started, 3 complete games(2 complete game shutouts), 1.32 WPA, 72.6% cWPA; World Series Winner/World Series MVP): This one is quite similar to the Koufax performance: high workload, amazing ERA, impressive WHIP, and two complete game shutouts(including a game seven one to clinch the series). While the strikeouts are significantly lower, Burdette’s WPA more than makes up for it. Burdette’s 1.32 WPA is the highest single World Series total that anyone in the time frame being evaluated has ever put up. In a lot of ways, this should be #1. But, it’s that other WPA metric that just barely holds Burdette back from cracking the top three.#3
1962 Ralph Terry(2-1 W-L, 1.80 ERA, 0.76 WHIP, 25.0 innings, 16 Ks, 3 games started, 2 complete games(1 complete game shutout), 1.18 WPA, 99.7% cWPA; World Series Winner/World Series MVP): If your a fan of advanced metrics, then probably a fan of this performance. The WHIP is impressive, but definitely not unheard of for this list. The strikeout total is average for the time period, and technically this is the worst ERA on this list. But, the impressive workload to go along with a game seven complete game shutout to finish off the series in style is just a bonus to the main course: off the charts advanced metrics. A WPA of 1.18 is massive, and good enough for the 4th best since 1955. Why this performance really piques my interest is the cWPA of 99.7%. This is absolutely insane! This is the highest single series total ever achieved in the history of the game. Since it is basically at 100%, that translates to Terry’s team being essentially hopeless in pursuit of this World Series title without him. The ERA is what prevents this one from being #1.#2
1991 Jack Morris(2-0 W-L, 1.17 ERA, 1.17 WHIP, 23.0 innings, 15 Ks, 3 games started, 1 complete game shutout; 1.32 WPA, 92.3% cWPA; World Series Winner/World Series MVP): The craziest part of this performance is that Morris’ complete game shutout not only happened in game seven to clinch, but it was also a 10 innings complete game shutout. This is an incredibly rare feat, and it was done in game seven of the World Series. Morris and the Twins barely held on in game seven for a 1-0 victory. This means that without Morris’ ridiculous 10 inning shutout, the Twins aren’t taking home the trophy. Morris’ importance can also be seen in his insanely high cWPA of 92.3%, which is the 2nd best of all time. Similar to the previous performance, Morris’ team is basically hopeless without him. What put this performance over Terry’s was the WPA of 1.32, which is the 2nd best ever achieved since 1955, and a significantly better ERA. However, that ERA, and the not so great WHIP is what prevents this from being the best.#1
2014 Madison Bumgarner(2-0 W-L, 0.43 ERA, 0.48 WHIP, 21.0 innings, 17 Ks, 1 save, 2 games started(3 total), 1 complete game shutout, 1.26 WPA, 92.1% cWPA; World Series Winner/World Series MVP): In what many would consider the greatest postseason a pitcher has ever had, Bumgarner shined brightest on the biggest stage. His advanced metrics are extremely similar to the previous two performances, which means they are incredible! What puts this one over the top is the incredible ERA and WHIP, which show that you were incredibly lucky to even get on base against Bumgarner in this series. His five shutout innings to earn the long save in game seven of this series, on only two days rest, is a massive bonus. When you factor in how rare complete games are in modern times(especially complete game shutouts), this performance is more than deserving of being #1.
About the Author
Brady Goodman is a senior at Samford University. He is a part of the sports analytics program.
Email: bgoodman@samford.edu
Twitter: b_good_8
LinkedIn: www.linkedin.com/in/brady-goodman-ocho8