"Nikola Jokic and Joel Embiid" by Erik Drost is licensed under CC BY-SA 2.0.
Each year, the selection for the NBA Most Valuable Player award sparks intense debate throughout all fans of basketball. However, since the process of selection is very subjective, it is difficult to explain the exact criteria needed to be met for a player to receive the MVP, and thus it is hard to predict who will end up winning the award. To solve this problem, a random forest machine learning model that ranks the most likely players to win MVP was created. The model predicts that the 2022-23 MVP will be Nikola Jokic again. A scraped dataset from basketball reference of NBA player statistics from the previous seasons was used, including metrics such as points, rebounds, and assists, along with advanced stats like win shares. Various feature engineering techniques were implemented and exploratory data analysis was conducted to identify what variables correlate most strongly with being named an MVP. The outcomes of this study reveal that a random forest model can effectively predict the MVP recipient with a reasonable degree of accuracy.
Introduction
Since the 1956-57 NBA season, the MVP trophy recipient has been awarded to the player who is most valuable to their team [1]. The award itself is decided by several basketball broadcasters, analysts, and sportswriters from the USA and Canada. Keeping this in mind, it is easy to see that there is a large amount of subjectivity involved in the decision for the award, as the term “most valuable” could have a variety of meanings to different voters. This raises the question of if there is a way to identify the patterns in the MVP decision as well as the most important statistics for the award, and if these patterns could be used to predict future MVPs. To answer this question, a random forest model was created. While previous models have been made to forecast the MVP, the aim here is to create a more accurate and robust one, and specifically observe which statistics matter the most for this award.
Data Gathering
The dataset used to train the model is from basketball-reference.com [2], and it contains data for all the past players who have received at least one MVP vote. In addition to basic statistics such as points, rebounds, and assists, the dataset contains win shares, voting points won, and share of the total votes. Of particular importance is this Share [3] variable, which is defined by the MVP voting points a player received divided by the total possible voting points that year. The equation is shown here.
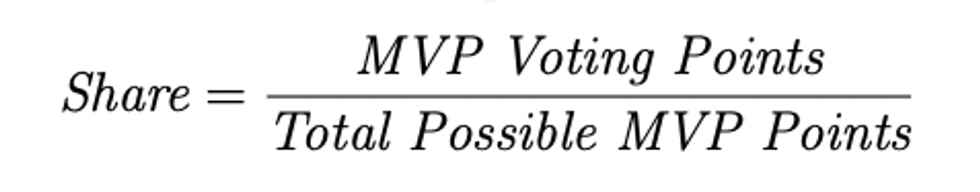
As the player with the highest share wins MVP, this is the value to use for the target variable of the model—it is what the model is trying to predict. Pts Won is not used as the target variable because the scale can vary from year to year as the number of voters changes—in previous years there were not as many votes, so the Pts Won for each player would be less than current years.
As this is a forecasting problem, data is scraped from the 2022-23 NBA season to test the final model on. This dataset contains data for every player who has played at least 1 minute in the NBA this season, and includes the same features as the testing dataset.
Data Manipulation
Since the goal of this study is to predict the MVP for the 2022-23 NBA season, only data from after 1985 is included, and the rest is dropped. In addition, player name and team values are dropped, as these do not relate to whether or not a player gets MVP. Points won and Points max are also unnecessary, as described earlier. All NaN values in the dataset are set to the average value for that variable in order to limit the effect of these nulls. Finally, the last step of data manipulation is normalization, which eliminates bias in the data. Normalization is important as it brings all features to the same scale. A model that assigns more significance to variables with larger ranges may generate biased predictions. For example, assists per game, which are an essential aspect of the game, may be overlooked by the model if the data is not normalized due to most players having much higher points per game. By normalizing the data, each input variable contributes equally to the prediction, irrespective of its scale, ensuring fairness. Normalization also enhances the accuracy of the model by creating comparable scales for input variables. This ensures that each variable is of equal importance in making predictions, preventing overshadowing by other variables with wider ranges. The normalization is done through sklearn’s preprocessing package.
Exploratory Data Analysis and Feature Engineering
Before training the model, exploratory data analysis is conducted to determine what statistics correlate best with MVP vote shares. This is an important step in determining feature importance in relation to vote shares and what feature combination to include for the model. Shown here are graphs of just two of the features that are tested against vote shares, and it can be seen that points per game and win shares have a strong correlation to large vote shares.
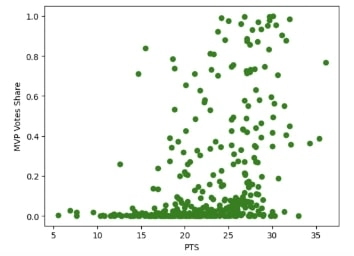
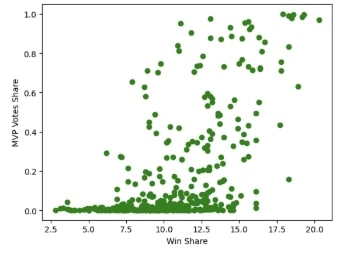
Based on the Share vs Pts graph, it can also be seen that most legitimate MVP candidates average at least 15 points per game. This can be confirmed with further research, as only two players have ever received the award while averaging below 15 points per game (Bill Russell and Wes Unseld) [4]. This is a key piece of information as now all players in the testing data set (2022-23 season) who average less than 15 points per game can be dropped, as they do not have a real chance at winning the award. This helps cut down the size of the dataset and reduce meaningless noise.
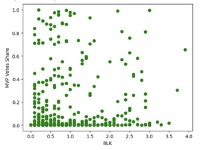
Further exploratory data analysis is done on defensive statistics like blocks per game and steals which do not have a strong relationship with high vote shares as can be seen below in the graph. Based on this analysis, these two statistics can be excluded from the final feature combination that will be used to train the model, as they are not good indicators of an MVP. Doing this reduces the dimensionality of the features, which in turns helps prevent overfitting in the model.
Model Explanation and MSE
The random forest model is a suitable algorithm for predicting the NBA MVP because its ensemble learning method can handle complex, non-linear relationships between features and targets. It can capture interactions between multiple features and provide a reliable and accurate prediction. Additionally, random forest is less prone to overfitting than other algorithms, meaning it can generalize well to new, unseen data.
As stated earlier, random forests implement an ensemble technique to predict a certain variable, in this case vote shares. Ensembling means that the model consists of several smaller models, called regression decision trees. Each individual regression tree in the random forest will output a prediction for the vote share variable, and all these predictions are then averaged to give the final output of the random forest model. This is the strength of the model, as insights drawn from multiple regression trees are more accurate than just one tree alone.
Fundamentally, the individual regression trees are tree-like structures that represent various decisions and their respective consequences. The tree recursively splits the data based on different feature conditions until it yields final output nodes, called leafs. The way a decision tree is judged is through a measure of impurity, which is a measure of uniformity between the target variables [5]. For regression trees, impurity is measured through mean squared error (MSE). A high MSE value signifies a large deviation from the true values of the target variable, and thus the aim is to reduce the MSE [6]. However, a perfect MSE of 0 means that the model is overfitting, and this is something that should be avoided. The equation for MSE is shown here.
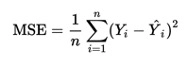
To calculate MSE, every predicted value for vote shares is subtracted from every actual value, and the result is squared. Then, all these values are summed together and divided by the total number of values. MSE is a useful metric in determining how to split the data in future iterations, and is a key factor in optimizing the model.
Training the Model
The features used to train the model are the following: games played, age, minutes per game, points per game, rebounds per game, assists per game, field goal percentage, free throw percentage, win share, and win share per 48 minutes. These are decided upon based on the exploratory data analysis done previously. For the random forest model itself, 1000 decision trees are used with a random state of 0, meaning that the train and test split is the same through every iteration. With these hyperparameters, the model receives a MSE of around 0.024, indicating relative purity in the forest predictions.
Testing the Model on the 2022-23 NBA Season
The results of the random forest model on the 2022-23 NBA Season are shown below:
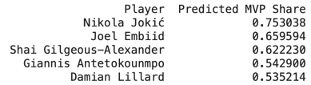
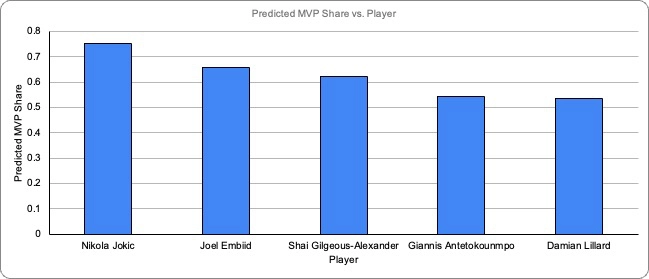
The model predicts that the previous years’ MVP, Nikola Jokic, will have the highest share of votes this year, and be awarded the trophy for the third straight year. Jokic is followed by last year’s runner up, Joel Embiid. This result that the model yields gives insightful information into this year’s MVP race, and confirms many analysts’ beliefs that Jokic deserves a third straight award. A surprising third place candidate in the model is the Oklahoma City Thunders’ Shai Gilgeous-Alexander, who is not on many people’s MVP ballot, possibly due to the little attention he and the Thunder receive from national media. When examined further, it makes sense that Gilgeous-Alexander should be in the race given how impactful he is to his team’s recent success. The fact that the model does not take into account media attention from a national stage could also help explain why Gilgeous-Alexander is predicted to come third in the race.
Feature Importance
The final step, and one of the most insightful, of the process is to determine feature importance, or what variables have the greatest impact on receiving more MVP votes. This is determined through the feature_importances package of sklearn, and the results are displayed below. Feature importance is generally calculated through measuring the decrease in impurity for nodes, which helps determine which variables have the biggest impact in yielding an accurate output.
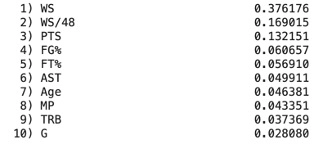
According to the chart, the win shares statistic has the greatest impact on the share of MVP votes a player gets. Win shares is a statistic that aims to estimate the number of wins a player contributes to their team through their individual performance. With the MVP being an award that is given to the “most valuable player”, it makes sense that the most important statistic is how much a player contributes to team wins.
Conclusion
Each year, the MVP race is a controversial subject, and this year is no different. However, through the use of machine learning and data analysis, Nikola Jokic seems to have had a strong case for this past year’s most valuable player. While there exist other machine learning models that implement different strategies for predicting the MVP, they often do not fully capture the complexity of the present statistics. In addition, this model is able to account for what statistics matter the most when it comes to the logic behind votes, and narrows it down to both win shares, and points per game—something that is often overlooked by existing MVP forecasting models. Conducting a feature importance test is also an important step in the explainability of the model, as it points to specific stats that help back up an MVP case. Win shares specifically is what aid Jokic’s campaign as his high rating in this statistic means that he contributes more to his team’s wins than any other player. To build onto the results of this model, the next step would be to gather data from online articles, tweets, and other media sources to perform sentiment analysis on what people think about certain players. The combination of this with the current model would create a much more robust method of forecasting future MVPs, as it would take into account not only pure statistics but also existing narratives surrounding candidates in the race.
About the Author
 Rohan Tummala is a current student at The Nueva School in San Mateo, CA with a deep interest in sports analytics.
Email: rohantummala07@gmail.com
References
[1] “What does MVP mean in basketball?”. Metroleague.
[2] “NBA Awards Voting”. Basketball Reference.
[3] “Award Share”. Wikipedia.
[4] Statmuse.
[5] “Decision Trees”. Spark.
[6] “Mean Squared Error”. Statistics By Jim.