Many fans underestimate the importance of the NFL draft beyond the first and second rounds, assuming that only early picks can truly impact a team's success. However, groundbreaking research from the Center for Sports Analytics at Samford University challenges this notion.
According to our study the drafting performance in rounds three, four, and five holds the key to future on-field success. Teams that excel in these middle rounds significantly increase their chances of winning more football games.
 Take the New England Patriots, for example. Despite their below-median performance in all rounds of the draft and a 30th ranking in early rounds performance, they shine in the middle rounds, ranking 3rd overall. Our research indicates this is likely a contributing factor to their league-leading total wins.
While success in the NFL is influenced by numerous uncontrollable factors, identifying significant trends like this one is essential. By acknowledging the critical role of middle-round draft picks, teams can better position themselves for long-term success on the gridiron.
"Chandler Smith's groundbreaking research sheds light on vital insights poised to revolutionize NFL draft strategies. Through an innovative 'market-based' approach, this study reveals the importance of prioritizing 'best available' talent in the middle rounds over focusing solely on specific team needs. These findings have the potential to reshape how teams approach player selection, paving the way for more informed and successful NFL draft decisions” said Darin White, PhD, executive director of Samford University’s Center for Sports Analytics.
Evaluating NFL Draft Success
Every year, the NFL Draft captivates football fans worldwide, offering a glimpse into the future of the league as teams vie to secure top talent and build for success. Immediately after the draft, NFL experts will begin to evaluate each team’s draft performance. The problem with this process is that the “expert” is usually incorrect in his analysis of the team’s selections. Although these draft grades build excitement (or disappointment) for fans of teams anticipating upcoming seasons, it is near impossible to evaluate a team’s draft performance before the draftees step foot on an NFL field. That is why we must wait until years removed from a draft to evaluate the success of a team’s drafting performance.
Many studies have been done to evaluate the drafting performance of NFL teams. However, this study differs from those by using a simple, yet profound methodology to measure a team’s ability to draft high quality players and compare it to on-field success. It is a market-based valuation approach that uses the total guaranteed money on a player’s second NFL contract to determine the value of that specific player, ultimately measuring a team’s draft performance.
Rather than relying on subjective player evaluation models, this approach follows the sound economical principle that value is determined through supply and demand in a free market. We will dive more into this concept, but first, let’s gain a thorough understanding of the data used in the study.
Data Explanation
The metric used to evaluate team performance on the field is total wins, and it is on the Y-axis of the graphs. This is the sum of wins (postseason included) for each team from 2011-2024. The metric used to measure team drafting performance is total guaranteed money, and it is on the X-axis of the graphs. This is the sum of the total guaranteed money on the second contract of individual players drafted by respective teams from the years 2011-2019. The 2019 draft is the latest draft we could include because some players from the 2020 draft have still not signed a second contract. Even though we only included the drafts up to 2019, we calculated total wins through 2024 because we needed to allow a buffer to see the impact of players drafted in 2018 and 2019.
A key note to make is that it is irrelevant if the player resigns with the team that drafted him or if he signs his second contract with a different team. The guaranteed money for each player only counts towards the team that drafted him. Let’s use Christian Wilkins as an example. Wilkins was drafted by the Dolphins in 2019. When his rookie contract expired, he signed his second contract as a free agent with the Raiders. The guaranteed money of $57 million on the second contract is credited to the Dolphins, not the Raiders because they were the team that drafted him, and we are evaluating drafting performance.
Guaranteed Money
Total guaranteed money is the metric used in this study because the guaranteed money on a contract gives the true market-value of the player. It is commonly known among the league that a contract is more like a suggestion. A four year, $100 million contract is not usually what it seems. If there is little guaranteed money included in the structure of the contract, then the team can terminate the player with little penalty. However, if there is a large amount of guaranteed money, then the team must adhere to the contract, or it will face severe salary cap consequences. Players who sign contracts with large amounts of guaranteed money, are seen as higher-quality players, and that is why it is the metric we used in this study.
Market-based Valuation Approach
The NFL operates within a dynamic economic framework that embodies the principles of a free market system. While often perceived as a highly regulated and centralized organization, the NFL’s structure and operations reflect the fundamental dynamics of supply and demand, competition, and market-driven decision-making. Free agency and contract negotiations are two elements of the league that follow this basic principle of economics.
In free agency, NFL players are like commodities in a marketplace. The efficiency of the NFL free agency market mirrors that of free markets in economics. In an efficient market, player contracts reflect the true value of players based on their contributions to team success, market demand, and competitive pressures. Market efficiency ensures that resources (players) are allocated efficiently to teams based on their perceived value and contributions to winning. If a player performs at high level during his rookie contract, he will be rewarded with guaranteed money on his second contract. If a player does not perform at a high level during his rookie contract, he will not receive guaranteed money on his second contract. That is what makes this methodology sound.
Many previous studies have attempted to evaluate team drafting performance. A significant problem with these methodologies is that their player performance metrics are subjective. This market-based valuation approach eliminates subjective evaluation metric errors, and it allows for the market to determine player value.
Interpreting the Graphs
The graphs below give a fantastic visual representation of NFL team draft performance from 2011-2019 and how this compares to on-field performance. The Y-axis is on-field performance represented by total wins. The X-axis is draft performance represented by total guaranteed money. The lines running through the graph are the median values of the axes, and the intersection of these medians form the quadrants for the graph. Here is how to interpret a team’s position on the graph:
Quadrant I (top right): High achievers. Teams who have drafted well and performed well on-field.
Quadrant II (top left): Overachievers. Teams who have drafted poorly but performed well on-field.
Quadrant III (bottom left): Low achievers. Teams who have drafted poorly and performed poorly on-field.
Quadrant IV (bottom right): Underachievers. Teams who have drafted well but performed poorly on-field.
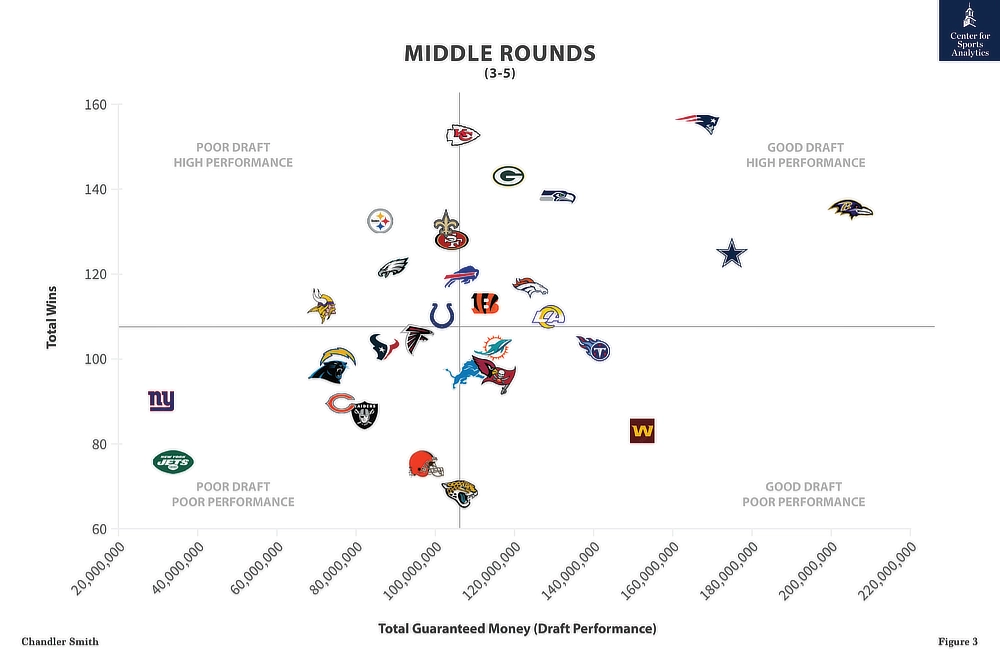
Figure 1 is overall draft performance from all rounds. Figure 2 is early round draft performance, which includes rounds one and two. Figure 3 is middle round draft performance, which includes rounds three, four, and five. Figure 4 is late round draft performance, which includes rounds six and seven. First, let’s look at all rounds draft performance.
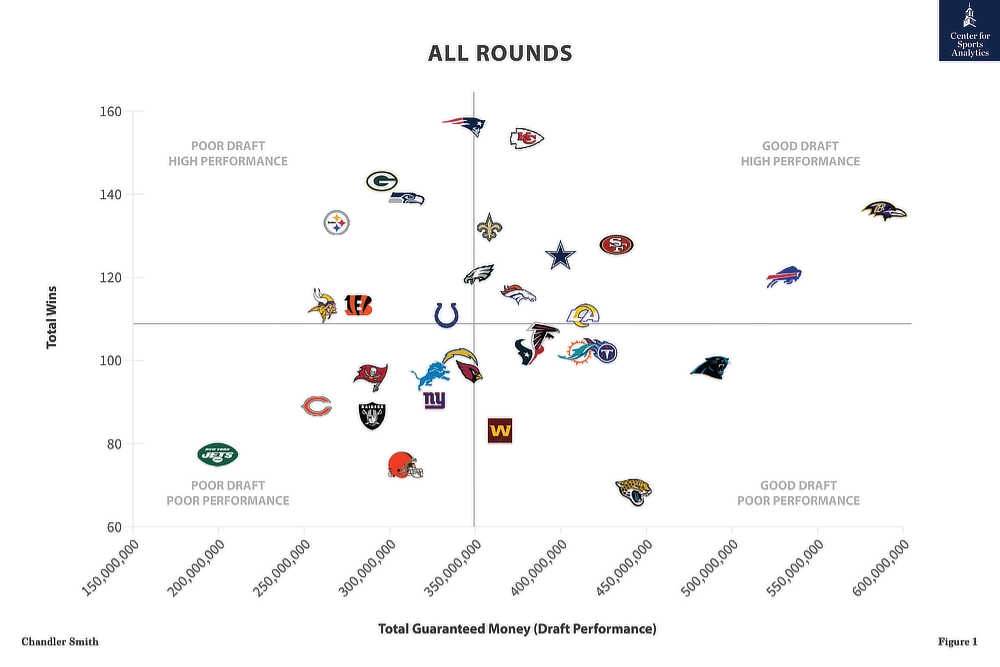
The Baltimore Ravens immediately stick out on the graph due to their outstanding drafting performance. They have accumulated nearly $600 million in guaranteed money on the second contracts of players they have drafted. That is nearly twice the median amount and triple the amount of the last place New York Jets. The difference (~$150 million) between the last place Jets and the median value is the same difference between the Ravens and Jacksonville Jaguars, the fourth place team. That is high level drafting performance.
On the other corner of the graph in quadrant III, reside the New York Jets. The Jets appear to be an outlier in this dataset, and it doesn’t take this graph to convince an NFL fan of that. The Jets have clearly not performed at a high level on the field, and their drafting ability matches their lackluster play. However, the Jets have turned it around the last few years, but this dataset does not account for those improvements yet. It will be interesting to see where the Jets land on this graph in five years from now.
The Pittsburgh Steelers, Green Bay Packers, and Seattle Seahawks are all prime examples of overachievers. These teams have not drafted well, but they continue to succeed on the field every year. On the other hand, teams like the Carolina Panthers and Jacksonville Jaguars are examples of underachievers. Residing in quadrant IV, these teams have had excellent draft performances, but it has not led to much success on-field. Winning is hard in the NFL.
The New England Patriots and the Kansas City Chiefs have dominated the NFL over the past 15 years, but they have not entirely dominated the draft. These two teams have combined to win six out of the last ten Super Bowls, and they are the top two teams in total wins between 2011-2024. However, it is interesting to note that they reside in the middle of the pack in draft performance, with the Patriots falling slightly behind the median at 18th and the Chiefs ranking 12th.
There are several possible explanations to this. One of which simply being Tom Brady. He is unlike any other athlete we have seen in professional sports in the longevity of his career. Being drafted in 2000, he was not accounted for in this study although he played a pivotal role in the Patriots’ success. Not to mention he is the reason why the Tampa Bay Buccaneers won a Lombardi Trophy, despite residing in quadrant IV in this graph.
Another possible explanation is that drafting players does not directly lead to on-field success. We can easily see this through the variance in the graph. There are so many different factors that go into winning in the NFL. From coaching to free agent acquisitions, to trades, to favorable referee calls, to luck of the bounce, there are so many recipes to success in the NFL, and that is why it is the most popular sport in the country.
Draft Round Breakdown
There is one fascinating trend that we find when we split the dataset into early round picks, middle round picks, and late round picks. There is a significant positive correlation in the middle round draft picks between total guaranteed money and total wins. Thus, meaning the better that a team drafts in rounds three, four, and five, the better the team performs on-field. The worse that a team drafts in these rounds, the worse the team performs on-field.
Below are the graphs for each split round picks. We ran a bivariate Pearson Correlation to test if there is a statistically significant relationship between total wins and total guaranteed money in each graph, and these results are listed in the tables below the graphs. Notice that the middle rounds graph was the only that had a significant correlation.
Early Rounds
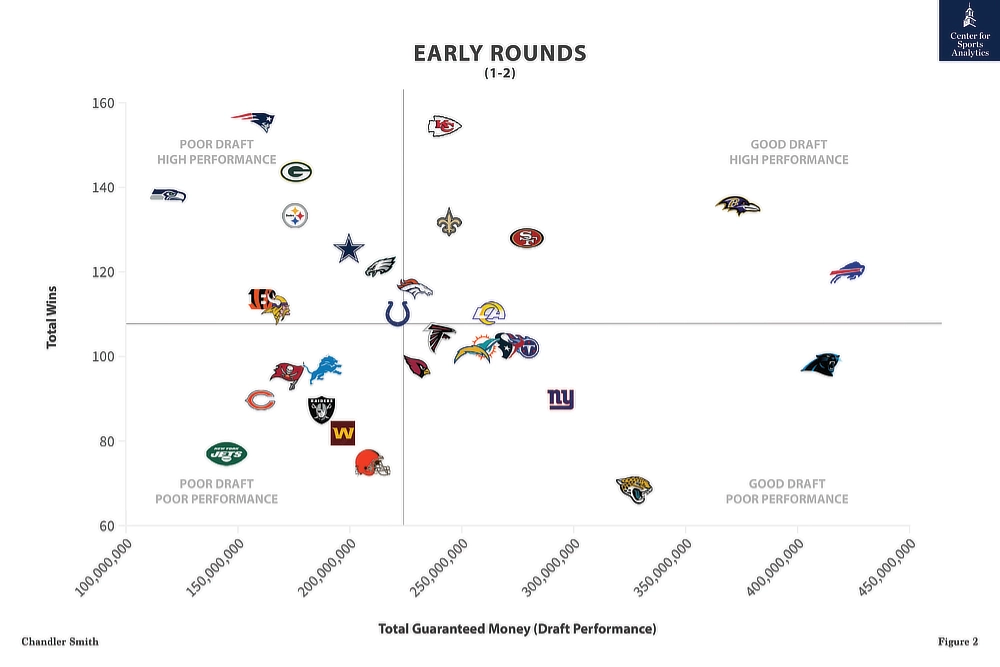
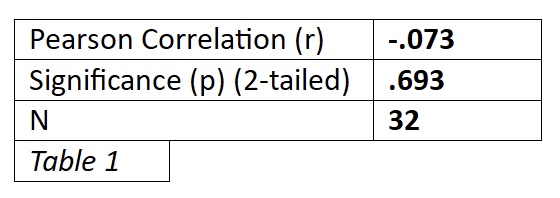
If it wasn’t evident enough from simply eyeballing the graph, there is little correlation in this graph. The results from the Pearson Correlation show a negligible relationship (r=-.073) between wins and total guaranteed money with a non-significant p-value of .693. There are several teams (Patriots, Packers, Seahawks, and Steelers) who have drafted poorly in the early rounds, but they have still performed at a high level on-field. There are also several teams (Giants, Panthers, and Jaguars) who have drafted well in the early rounds, but they have performed at a low level on-field. We do not see much correlation in the early rounds.
Middle Rounds
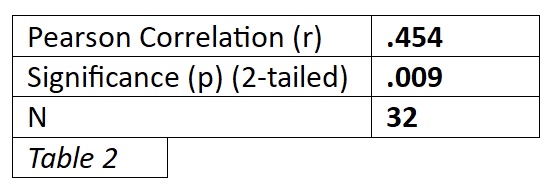
The positive correlation in the middle rounds graph is visibly noticeable, and this stands true after running the numbers. The Pearson Correlation (r) of .454 represents a moderately strong, positive relationship between total wins and total guaranteed money, and the p-value of .009 makes it statistically significant. This is by far the strongest correlation among any of the other graphs in the study.
It is crucial to understand that correlation does not mean causation. However, the relationship among middle round draft picks between total wins and total guaranteed money is fascinating. Many fans disregard the NFL draft after the first and second rounds, thinking that these are the only players who will improve their team, but they are terribly mistaken. This study shows that the drafting performance of teams in rounds three, four, and five have the most significant relationship with on-field performance. If a team drafts better in these middle rounds, they are more likely to win more football games.
The New England Patriots are the perfect example for this trend. The Patriots are below the median in all rounds draft performance and 30th in early rounds performance, but they are 3rd in middle rounds performance. Is this why they lead the league in total wins? It could be a major reason. Like we mentioned earlier, correlation does not mean causation, and there are so many uncontrollable factors that lead to success in the NFL. Although, when a significant trend arises like this one, we must not just glance over it.
Late Rounds
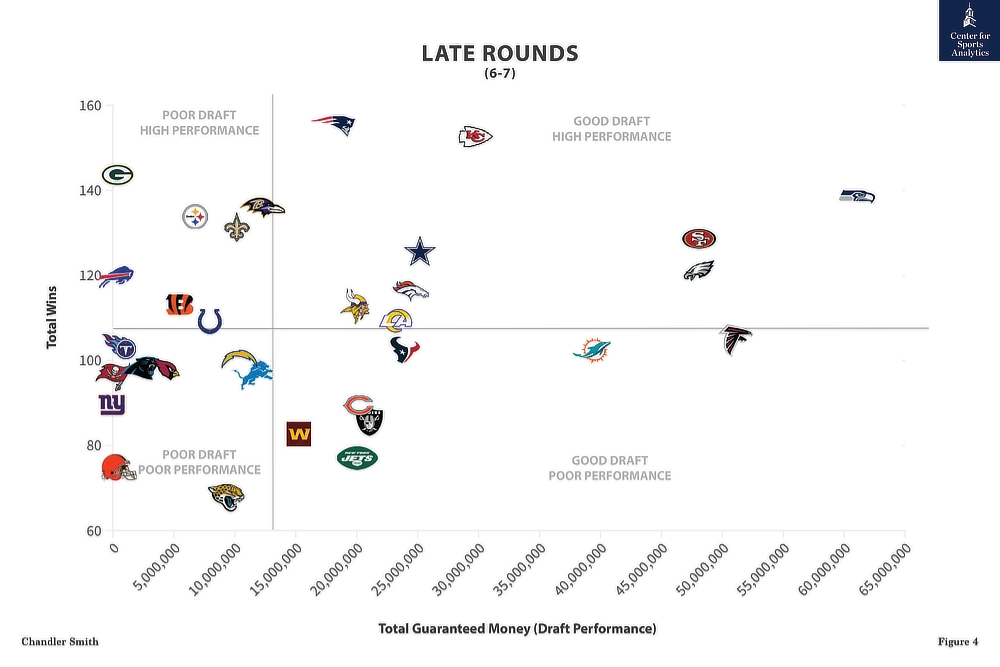
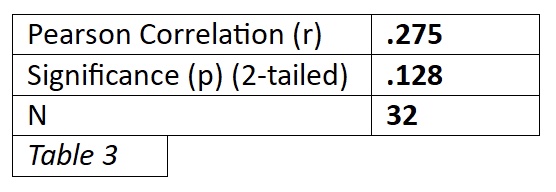
There is a low correlation between total wins and total guaranteed money in the late round draft picks, but it is a small relationship (r=.275). This value is also not statistically significant (p=.128), but it is still a noteworthy trend with several of the highest performing teams (Chiefs, Ravens, 49ers, Eagles, and Patriots) in quadrant I.
Tying It All Together
It is evident from the graphs and the Pearson Correlation that the most significant relationship between draft performance and on-field performance comes from the middle rounds. Teams who draft well in rounds three through five are the ones who have the most success on-field.
One possible explanation for this phenomena could be that these are the rounds where a player has the most potential to boom or bust. What I mean by this is that a player taken in the fourth round could easily be a future hall of famer who slipped in the draft, or he could be a player that a team mistakenly reaches for who should have been a late round pick. We see this more in the middle rounds than we do in the early or late rounds. Sure, you have your Tom Brady’s or Brock Purdy’s who fall to the late rounds and eventually become star players. You also have your Ryan Leaf’s and JaMarcus Russell’s who are drafted early and never live up to the hype. These things do happen, but they happen much more often in the middle rounds than the early or late rounds. If a team hits on the right players in these middle rounds, it can lead to long term on-field success.
The methodology of this study is captivating because it eliminates subjective evaluation of players and, ultimately, draft performance. Rather than relying on player grades, this system allows the market to give value to players, mirroring the economics of the NFL. The graphs give excellent visual representations of how a team’s drafting performance compares to its on-field performance. The trend we see in the middle rounds through the positive relationship between drafting performance and on-field performance is fascinating. Teams must continue to do their homework on middle round draftees, and fans should not turn the TV off after day one of the draft.