As the 2019 NFL season approaches, fans, analysts, coaches, and players alike, are all preparing and getting excited for the season ahead. This article will take a look at some statistics from last year’s season to draw some conclusions about what to expect this coming year. The goal of this article is to identify which aspect, if any, of the game appears to be most crucial to winning in football. We will determine this by comparing each NFL team’s 2018 regular season win total with the following four aspects of the game: offensive pass yards per game, offensive rush yards per game, defensive pass yards allowed per game, and defensive rush yards allowed per game. Through linear regression, we will be able to determine which aspect’s success leads to the most wins. Thus, we will be able to make a claim, backed by statistical evidence, as to which area of the game is most important to winning.
From linear regression analysis, each aspect will be accompanied by a graph, regression line, and correlation coefficient. The graphs will highlight the association between each statistic and what success it led to in the 2018 season. The regression line will then provide more context as to how many wins specifically each aspect’s success leads to. Finally, the correlation coefficient will provide even more context as to which aspect is proven to lead to the most success.
Passing Offense
The following graph shows each NFL team’s 2018 regular season win total in comparison to their offensive pass yards per game.
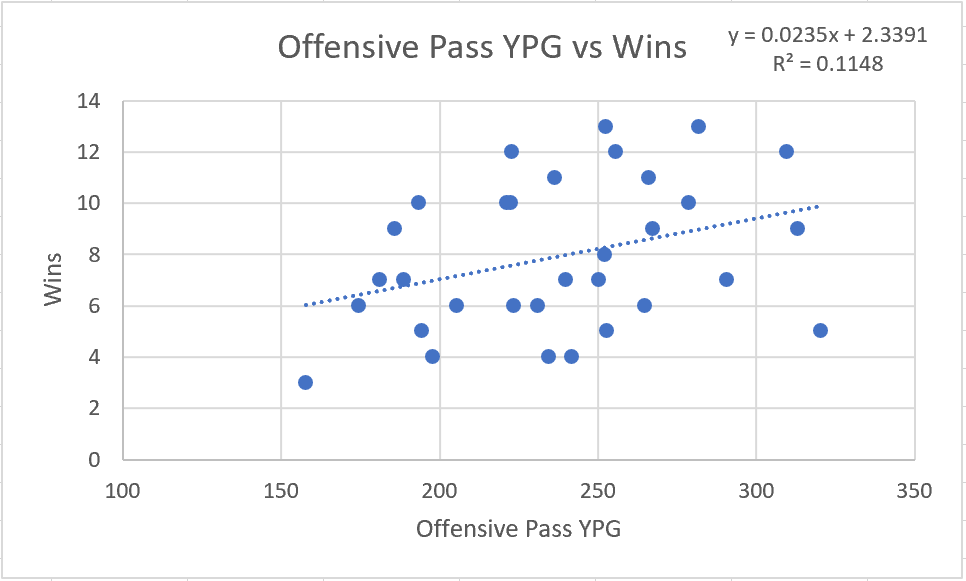
Regression line: y = .0235x + 2.3391
According to the regression line of this graph, an increase of 85 pass yards per game last season would’ve led to two more wins, on average, for any given team.
Correlation coefficient: r = .3388 (moderate positive correlation)
The correlation coefficient for the association between offensive pass yards per game and wins for the 2018 NFL season was .3388. This means that there is some, but not strong, statistical evidence that gaining more pass yards per game leads to winning more NFL games.
Best of 2018: Tampa Bay Buccaneers (320.3 YPG, 5 wins)
Worst of 2018: Arizona Cardinals (157.7 YPG, 3 wins)
Rushing Offense
The following graph shows each NFL team’s 2018 regular season win total in comparison to their offensive rush yards per game.
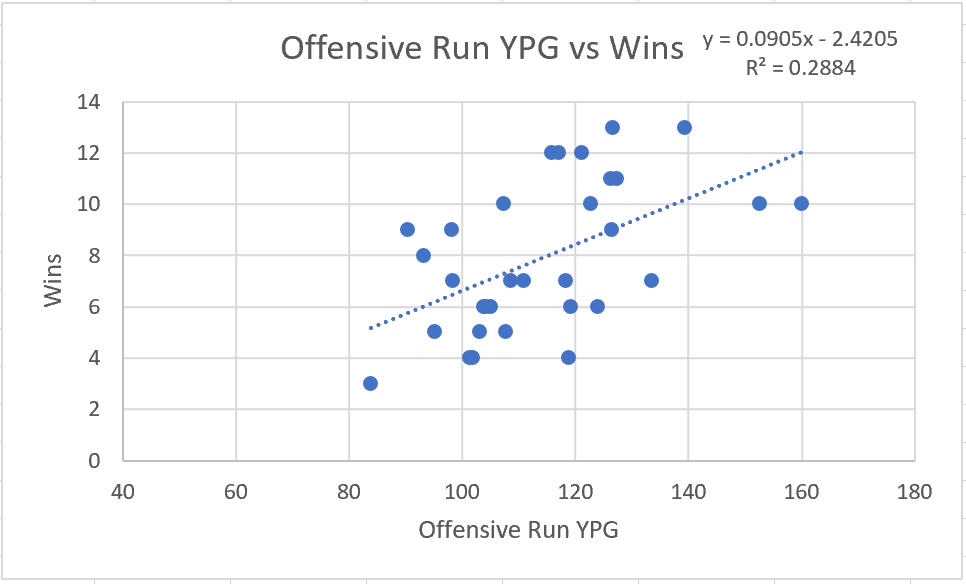
Regression line: y = .0905x – 2.4205
According to the regression line of this graph, an increase of 22 pass yards per game last season would’ve led to two more wins, on average, for any given team.
Correlation coefficient: r = .5370 (moderate positive correlation)
The correlation coefficient for the association between offensive pass yards per game and wins for the 2018 NFL season was .5370. This means that there is stronger, but still not convincing, statistical evidence that gaining more rush yards per game leads to winning more NFL games.
Best of 2018: Seattle Seahawks (160.0 YPG, 10 wins)
Worst of 2018: Arizona Cardinals (83.9 YPG, 3 wins)
Passing Defense
The following graph shows each NFL team’s 2018 regular season win total in comparison to their defensive pass yards allowed per game.
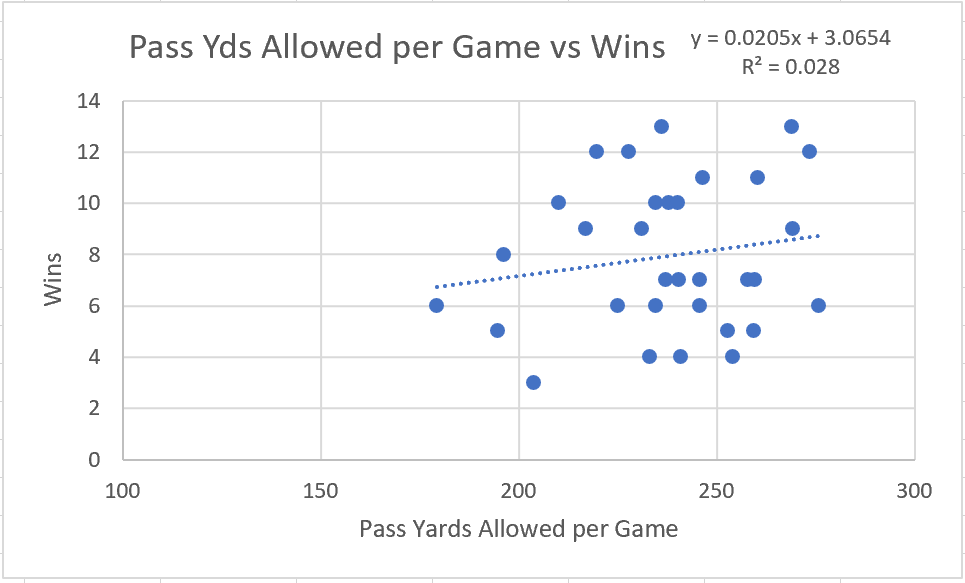
Regression line: y = .0205x + 3.0654
According to the regression line of this graph, an increase of about 100 pass yards allowed per game last season would’ve actually led to two more wins, on average, for any given team.
When comparing defensive statistics with wins, we expect to receive a negative correlation coefficient. This is because we are comparing defensive yards allowed per game with wins, and we expect that allowing fewer yards per game would essentially lead to more victories.
Correlation coefficient: r = .1673 (weak positive correlation)
The correlation coefficient for the association between offensive pass yards per game and wins for the 2018 NFL season was .1673. This means that there is no statistical evidence that allowing fewer pass yards per game leads to winning more NFL games.
Best of 2018: Buffalo Bills (179.2 YPG, 6 wins)
Worst of 2018: Cincinnati Bengals (275.9 YPG, 6 wins)
Rushing Defense
The following graph shows each NFL team’s 2018 regular season win total in comparison to their defensive rush yards allowed per game.
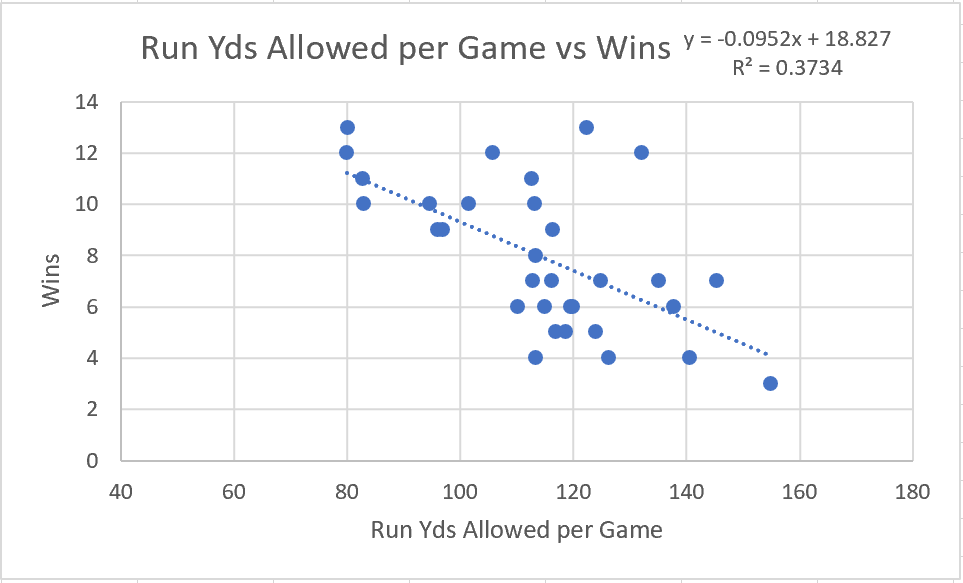
Regression line: y = -.0952 + 18.827
According to the regression line of this graph, a decrease of 21 rush yards allowed per game last season would’ve led to two more wins, on average, for any given team. Therefore, giving up an extra 21 rush yards allowed per game led to two more losses, on average, for any given team in 2018.
Once again, when comparing defensive statistics with wins, we expect to receive a negative correlation coefficient. This is because we are comparing defensive yards allowed per game with wins, and we expect that allowing fewer yards per game would essentially lead to more victories.
Correlation coefficient: r = -.6111 (moderate negative correlation)
The correlation coefficient for the association between offensive pass yards per game and wins for the 2018 NFL season was -.6111. This means that our most convincing statistical evidence says that allowing fewer rush yards per game leads to winning more NFL games.
Best of 2018: Chicago Bears (80.0 YPG, 12 wins)
Worst of 2018: Arizona Cardinals (154.9 YPG, 3 wins)
Conclusions
Now we can draw some conclusions from our linear regression analysis and the statistical evidence it provides. The least important aspect of the game from the 2018 season, in terms of leading to wins, was defensive pass yards allowed per game, where we found no correlation. It was then followed by offensive pass yards per game and offensive rush yards per game, both of which had moderate positive correlations. Lastly, the most important aspect, and convincing statistic, to winning games in the NFL last season was defensive rush yards allowed per game.
Sources
www.espn.com
www.nfl.com
About the Author
Connor just completed his sophomore year at Purdue University, where he is pursuing a double major in actuarial sciences and applied statistics, with a minor in management. He has had a passion for both sports and statistics since a very young age, and enjoys discovering all the new information statistics can give us about sports. LinkedIn