Major League Baseball (MLB) games are arguably one of America’s favorite entertainment events. Thirty teams battle each year for the coveted Commissioner’s Trophy to be crowned World Series champion. There is often lively debate on what aspect might lead to each team’s success: strong starting pitching, a deep bullpen, a strong defensive squad, or a balanced hitting lineup. Of course, each of these can play an important role in delivering a championship over the course of a season.
Beyond specific characteristics of roster construction, key organizational resources include those not found in dugouts or wearing uniforms. I am interested in investigating the impact of each of an organization’s four prominent roles: the owner, the general manager, the (field) manager, and the players. Which of these four is the most important factor in a team’s success?
Owners
People who say the owner is the most important part of the franchise use the argument, “it starts at the top.” Since the owner is the head of the organization, they have final authority on the hiring of all positions and approve the main players signed (or traded) to their organization. Owners also are responsible for setting the tone or vision of their franchise. Many MLB owners are former or current business executives who know how to be successful.
General Managers
Others might argue that the general manager (GM) is the most important role in baseball because they typically have authority on the designs and development of the overall roster and for overseeing player transactions. GMs are the ones responsible for drafts, trades, and free agency. Every player must go through the GM to get into the organization. The GM works hard to get that “franchise player” and to build a functional roster that can win. They are the deal makers and deal breakers, finding undervalued players and developing organizational depth that can compete for championships.
Manager
The manager might also be viewed as the most important role because of their direct contact with the on-field playmakers. The manager, or head coach, is the individual that is responsible for developing the talent on the roster. They are with the players every day during the season to asses who is the best and who deserves to be put in the lineup on a given day. The manager has the closest and most direct impact on the players daily, and is responsible for in-game decisions (e.g., batting order, pitching changes, pinch hitting appearances, defensive replacements) that influence winning or losing each individual game.
Player
The argument of the player being the one who contributes the most is somewhat obvious. The player is the one who pitches, hits, makes the defensive plays, scores the runs, and directly decides the outcome of games. On a game day, they contribute with the actual plays that directly impact the score and whether a team wins or loses. For my purposes, I focused on the single “best” player on a team for a given year, based on their wins above replacement (WAR) calculations. WAR is a metric that has gained popularity in recent years and is considered an overall metric of a player’s skill. Specifically, it measures a player’s overall worth above a replacement player. So, if a player’s WAR is 4.3, then they are 4.3 games better than their replacement at their respected position. In other words, a player is worth +4.3 more wins to their team in a season. (There are several different ways popularized to calculate WAR; for this research, I selected Baseball-Reference’s version, also commonly referred to as bWAR.)
Methodology
The four variables listed above were the independent variables in the study. For owner and general manager data, I used the individual team webpages on MLB.com. I collected manager data from Baseball-Reference. The player data were taken from Baseball-Reference and then sorted by WAR in a pivot table in Excel. Where necessary, I used supplemental articles or blogs to fill in missing data.
As I was looking to determine who had the greatest impact on a team’s performance, I selected a team’s winning percentage as the dependent variable. It directly shows how a team performs over the course of an entire season. I chose this over other success factors, such as if the team made the playoffs or if they won a championship, because it shows sustained success and I thought a better metric than including outcomes of short series and small samples (e.g., a one-game “wild card” matchup or even the World Series). To find each team’s winning percentage from 1975-2019, I collected seasonal data from Baseball-Reference, imported it into Excel, and then calculated the winning percentage from wins and games played.
I chose to collect data starting with the 1975 MLB season because it was the start of free agency, an ideal opportunity to “balance” the field and which increased the competitive efforts of front-office personnel as they had increasing opportunity to retool their major league roster.
Analysis
To analyze my data, I conducted a variance decomposition analysis. Variance decomposition shows the amount of variance of an outcome variable that can be attributed to each independent variable. It allows one to determine how much of the variance can be explained regarding the dependent variable.
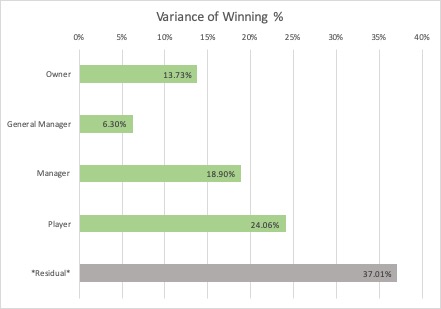
The four variables are displayed in the graph above, illustrating the amount of variability explained in a team’s winning percentage. Owner represents the amount of variance between owners. General manager represents the amount of variance between GM’s within a given owner. Manager represents the amount of variance between managers within a given GM. Player represents the amount of variance between players within a given manager. Residual is the remaining influence on a team’s winning; it represents the variance within a top player’s performance over time as well as the overall performance of the other players on the roster. Within this large amount of variance, we can see how player performance can vary from one season to the next.
Of the specific roles under investigation, as might be expected, a player’s impact on a team’s winning percentage from year to year is the most consequential, with 24.06% of variability explained. Managers comprise 18.90% of the variability. These two variables, as mentioned above, directly impact a team the most on game days, so that is likely why we see them account for larger percentages of the variability. However, we also should give credit to the other levels of management. GMs make up only 6.30% of the variance, while owners total 13.73%. Together they represent just over 20% of the variability explained.
Conclusion
Through this study I was able to see the most impactful piece of an MLB franchise. While the player and manager positions might be what people expect (though I might have expected the player’s variance to be even larger), it was interesting to see that the owner has a greater impact than what the GM typically does. Some might say that the owner’s part is larger because they are responsible for the money brought into the team and the culture in which the team is run. It also may be because they direct the GM or have final “sign-off” on any major transactions, likely limiting what a GM can do autonomously for a team. Therefore, the GM isn’t necessarily making as many independent decisions, they are just acting on the owner’s ideas and directives. Nonetheless, it is surprising that GM’s are only responsible for such a small amount of variance in a team’s winning because they do have such a significant role in the hiring, firing, and trading of coaches and players.
I think that this study provides a strong groundwork for organizational decision making. It also might be helpful in guiding future research on sports entities. For instance: Is there some threshold for how long a player, manager, GM, or owner has to be with a team to have a notable impact on a team’s winning percentage? Should front office personnel be on performance-based contracts similar to players? Are there different “eras” in baseball in which these findings would be different (e.g., after the rise in popularity of “Moneyball” and the influence of analytics, did the GM become more integral to success)? Would there be differences in the analysis if alternative dependent variables were used (e.g., division titles or World Series titles)? Future research on these suggestions—or many others—can provide interesting information for MLB personnel and fans.
If a team has the same goal every year, which is winning, every part of the organization should be responsible. Though the manager and/or GM is usually the first to go when a team doesn’t perform well, this analysis might help fans realize that accountability is distributed across each level of the organization.
References
Baseball-Reference.com
MLB.com
Fangraphs.com
hbr.org/2019/04/whos-the-most-important-member-of-an-nfl-franchise?utm_medium=email&utm_source=newsletter_daily&utm_campaign=dailyalert_not_activesubs&referral=00563&deliveryName=DM35201
About the Author
Emily Barnett is a senior at Samford University majoring in marketing with a concentration in data analytics. She is also on the softball team at Samford. Upon graduation, Emily hopes continue her passion working with sports analytics.
Twitter: @embarnett12
LinkedIn: www.linkedin.com/in/emily-barnett