Goals forced or goals allowed? What means more when it comes to advancing past the group stage of the World Cup?
Every four years, the world turns its attention to the World Cup. While familiar legends and new faces take the field, there always seems to be drama that unfolds. As a spectator, one can only hope that their team succeeds. But what does it take for your favorite team to make it to the knockout rounds of the biggest tournament on the planet?
In this research, a few specific factors were measured. Taking the games played in the group stages, data was gathered for World Cup’s during the 21st century. In other words, the data collected was from 2002-2018 for a total of five cups. The variables analyzed were goals forced and goals allowed per game. To make it easier to graph, the final result of how a team performed was classified into six categories as follows:
1 - Group Stage
2 - Round of 16
3 - Quarterfinals
4 - Semifinals
5 - Runner Up
6 - Champion
Supporting Graphs
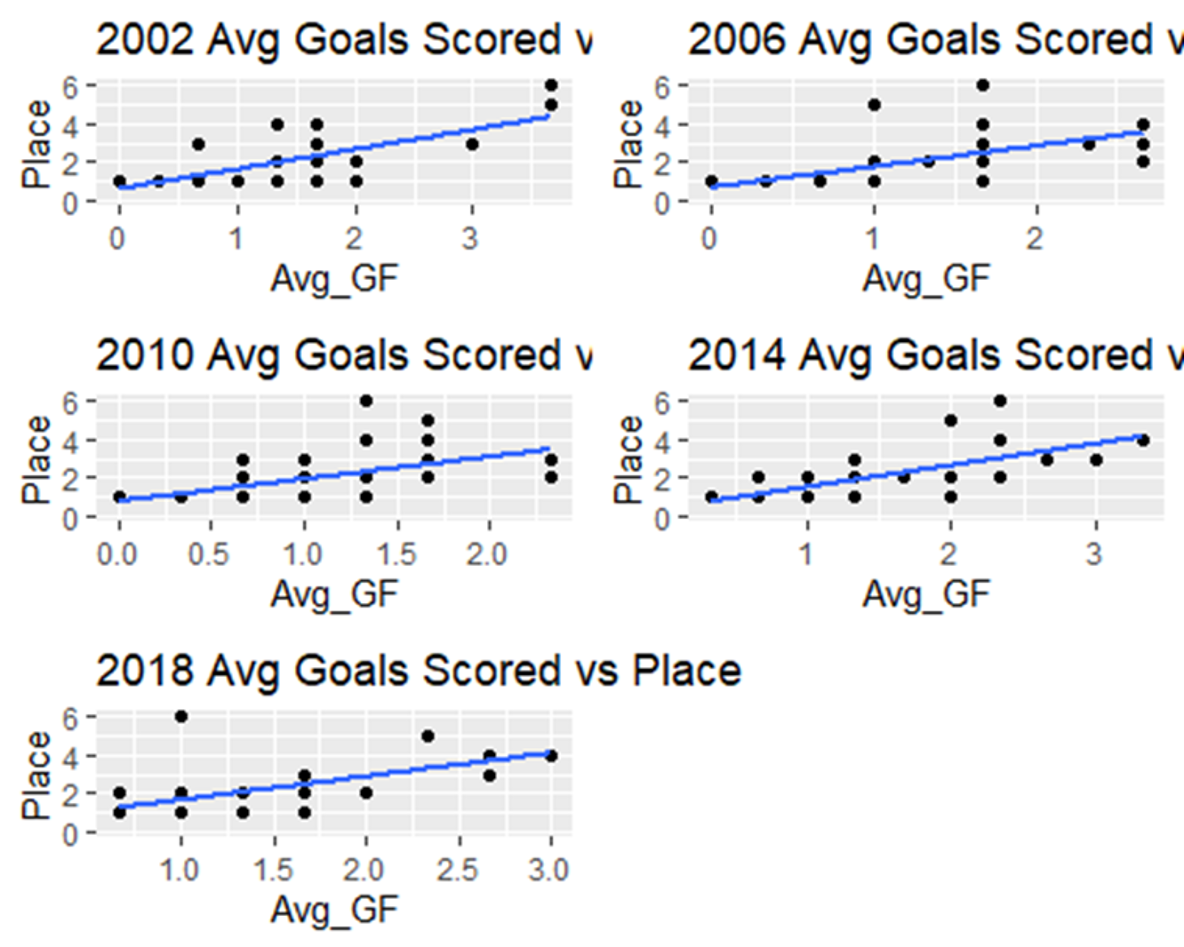
The first set of graphs show that the relationship between goals forced per game and where the team placed was roughly linear for each year.
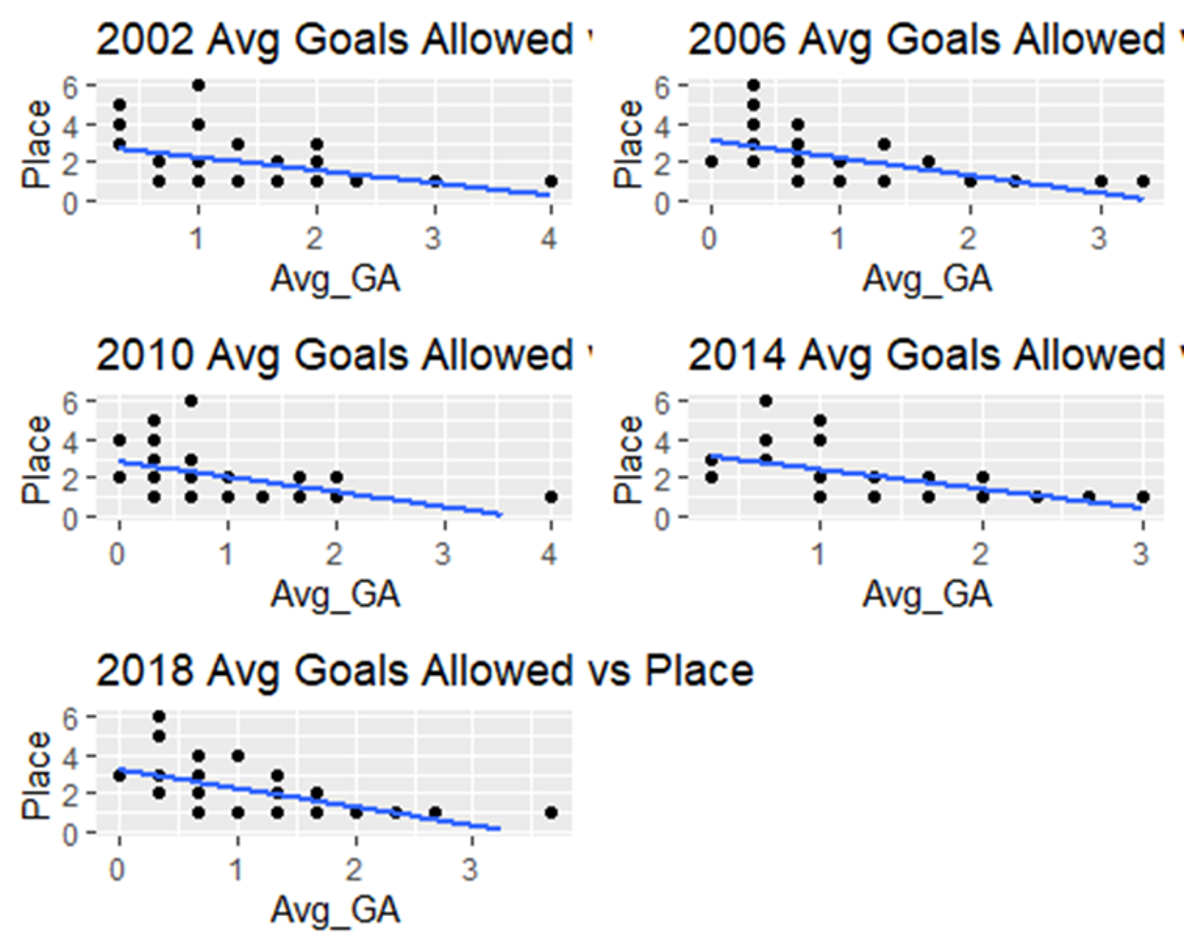
The same can be said for the next set of graphs showing goals allowed per game.
Linear Models
Now that a linear relationship seems to exist, equations can then be calculated to see whether a team made the knockout stages, as well as where they placed in the World Cup. This can be achieved by using a linear model. From this data, one can determine whether goals forced, goals allowed, or both, would be a better indicator for World Cup success. Below is an example of the code and data used for the year 2002 for both goals forced and goals allowed per game:
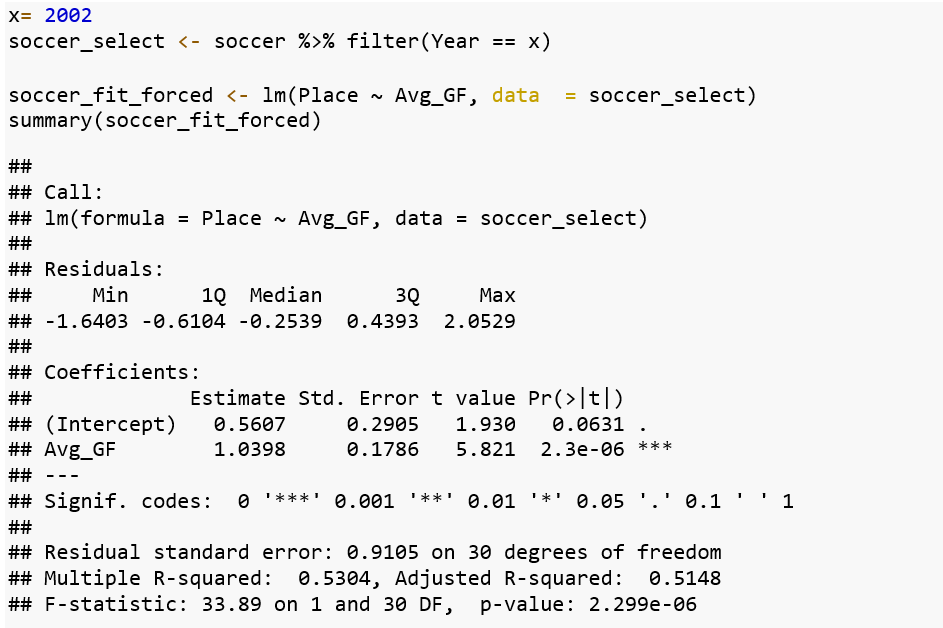
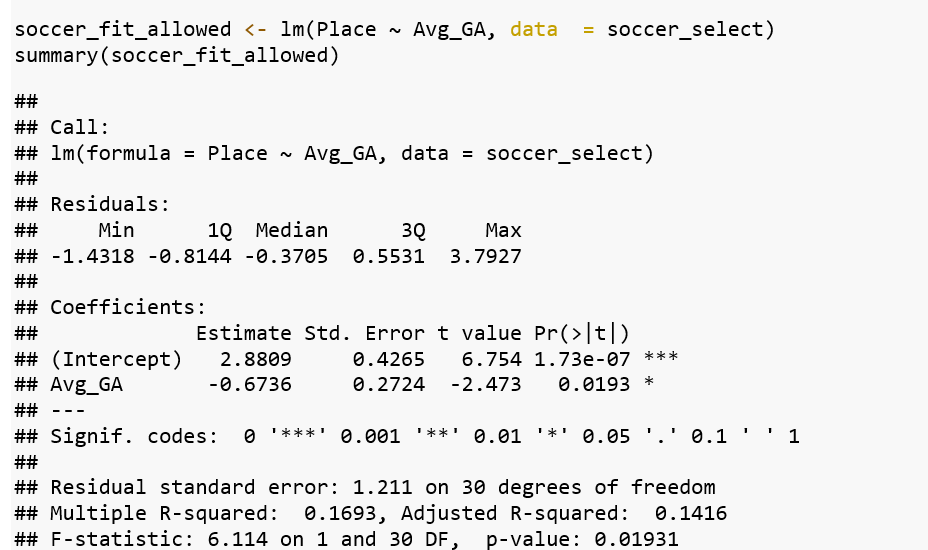
Using the coefficients, the formulas can be obtained. The r-squared value ranges from 0 to 1, and gives a sense of how much the dependent variable is affected by the independent variable (in this case, how much the result of a team depends on average goals scored/allowed). The closer the value is to 1, the better the correlation, and vise-versa. In this case, the greater r-squared suggests that goals forced is a better indicator for the year 2002:
Place = 0.5607 + 1.0398 * (Avg GF); R-squared = 0.5148
Place = 2.8809 - 0.6736 * (Avg GA); R-squared = 0.1416
The rest of the predictions for each year are listed below:
2006:
Place = 0.6334 + 1.0957 * (Avg GF); R-squared = 0.3133
Place = 3.0946 - 0.9238 * (Avg GA); R-squared = 0.3352
2010:
Place = 0.7388 + 1.1690 * (Avg GF); R-squared = 0.2339
Place = 2.7975 - 0.7877 * (Avg GA); R-squared = 0.2117
2014:
Place = 0.3494 + 1.1431 * (Avg GF); R-squared = 0.4368
Place = 3.4245 - 1.0276 * (Avg GA); R-squared = 0.3192
2018:
Place = 0.3960 + 1.2375 * (Avg GF); R-squared = 0.4078
Place = 3.2127 - 0.9789 * (Avg GA); R-squared = 0.2925
While goals forced seems to be the better indicator based on the r-squared value for most cases, it would be more beneficial to use a multiple regression model to see if using both goals forced and goals allowed in the same equation would better predict success. The resulting formula for each year is listed below:
2002:
Place = 1.1102 + 0.9493 * (Avg GF) - 0.3153 * (Avg GA); R-squared = 0.5334
2006:
Place = 1.8704 + 0.7277 * (Avg GF) - 0.6470 * (Avg GA); R-squared = 0.4362
2010:
Place = 1.6311 + 0.9141 * (Avg GF) - 0.5931 * (Avg GA); R-squared = 0.3381
2014:
Place = 1.6527 + 0.8959 * (Avg GF) - 0.6727 * (Avg GA); R-squared = 0.5509
2018:
Place = 1.5739 + 1.0065 * (Avg GF) - 0.6958 * (Avg GA); R-squared = 0.5417
By using both goals forced and goals allowed, the r-squared values are greater, indicating a better relationship. This shows that when analyzing whether a team will make it to the knockout stage, both goals forced and goals allowed should be analyzed instead of simply focusing on only one of the variables.
Predicting 2022 World Cup Success
Now that it is more beneficial to use both goals forced and goals allowed when analyzing World Cup success, the following formula can be obtained that combines all data from the past five World Cups:
Place = 1.58474 + 0.89087 * (Avg GF) - 0.58671 * (Avg GA)
For example, if a team averages 4 goals per game over the group stage, and gives up an average of 1 goal per game in the group stage, the result would be as follows:
Place = 1.58474 + 0.89087 * (4) - 0.58671 * (1)
Place = 4.56151
Not only would this team make the knockout stage, but they would have a great chance of making it to the semifinals of the World Cup. In this way, fans can have a sense of how their team needs to perform in the group stage in order to have success in this year's World Cup.
Predicting Group Stage Results
There are many intriguing questions surrounding the teams participating in this years World Cup. Will host nation Qatar make a surprise jump into the knockout round? Will France rebound after a disappointing effort in the Euros? What are the chances that Ronaldo and Messi face each other for the first time in the World Cup?
Using betting odds, expert predictions, and current form (many World Cup favorites were shockingly disappointing during this summer international break), the group stage in this year's World Cup could turn out as such:
Group A:
Qatar (1) vs Ecuador (1)
Senegal (1) vs Netherlands (2)
Qatar (1) vs Senegal (2)
Ecuador (1) vs Netherlands (3)
Qatar (1) vs Netherlands (3)
Ecuador (0) vs Senegal (2)
Group B:
England (3) vs Iran (0)
USA (2) vs Wales (1)
England (2) vs USA (1)
Iran (1) vs Wales/Ukraine/Scotland (2)
England (2) vs Wales (1)
Iran (0) vs USA (2)
Group C:
Argentina (4) vs Saudi Arabia (0)
Mexico (2) vs Poland (3)
Argentina (3) vs Mexico (0)
Saudi Arabia (1) vs Poland (3)
Argentina (2) vs Poland (0)
Saudi Arabia (0) vs Mexico (2)
Group D:
France (3) vs Australia (0)
Denmark (3) vs Tunisia (0)
France (3) vs Denmark (3)
Australia (1) vs Tunisia (1)
France (3) vs Tunisia (0)
Australia (1) vs Denmark (2)
Group E:
Spain (3) vs Costa Rica (0)
Germany (3) vs Japan (1)
Spain (3) vs Germany (2)
Costa Rica (1) vs Japan (1)
Spain (3) vs Japan (0)
Costa Rica (0) vs Germany (3)
Group F:
Belgium (2) vs Canada (1)
Morocco (0) vs Croatia (2)
Belgium (2) vs Morocco (0)
Canada (1) vs Croatia (2)
Belgium (2) vs Croatia (1)
Canada (3) vs Morocco (0)
Group G:
Brazil (3) vs Serbia (1)
Switzerland (1) vs Cameroon (1)
Brazil (2) vs Switzerland (0)
Serbia (2) vs Cameroon (0)
Brazil (3) vs Cameroon (0)
Serbia (2) vs Switzerland (1)
Group H:
Portugal (1) vs Ghana (0)
Uruguay (2) vs South Korea (1)
Portugal (2) vs Uruguay (2)
Ghana (1) vs South Korea (1)
Portugal (3) vs South Korea (1)
Ghana (1) vs Uruguay (2)
Based on these predictions, fans can then take the top two teams in each group and use the formula from before to determine where their team would place in the knockout stages:
Group A:
Netherlands: 1.58474 + 0.89087 * (2.67) - 0.58671 * (1) = 3.38
Senegal: 1.58474 + 0.89087 * (1.67) - 0.58671 * (1) = 2.49
Group B:
England: 1.58474 + 0.89087 * (2.33) - 0.58671 * (0.67) = 3.27
USA: 1.58474 + 0.89087 * (1.67) - 0.58671 * (1) = 2.49
Group C:
Argentina: 1.58474 + 0.89087 * (3) - 0.58671 * (0) = 4.26
Poland: 1.58474 + 0.89087 * (2) - 0.58671 * (1.67) = 2.39
Group D:
France: 1.58474 + 0.89087 * (3) - 0.58671 * (1) = 3.67
Denmark: 1.58474 + 0.89087 * (2.67) - 0.58671 * (1.33) = 3.18
Group E:
Spain: 1.58474 + 0.89087 * (3) - 0.58671 * (0.67) = 3.86
Germany: 1.58474 + 0.89087 * (2.67) - 0.58671 * (1.33) = 3.18
Group F:
Belgium: 1.58474 + 0.89087 * (2) - 0.58671 * (0.67) = 2.97
Croatia: 1.58474 + 0.89087 * (1.67) - 0.58671 * (1) = 2.49
Group G:
Brazil: 1.58474 + 0.89087 * (2.67) - 0.58671 * (0.33) = 3.77
Serbia: 1.58474 + 0.89087 * (1.67) - 0.58671 * (1.33) = 2.29
Group H:
Portugal: 1.58474 + 0.89087 * (2.67) - 0.58671 * (1) = 3.38
Uruguay: 1.58474 + 0.89087 * (2) - 0.58671 * (1.33) = 2.59
Below are the final results:
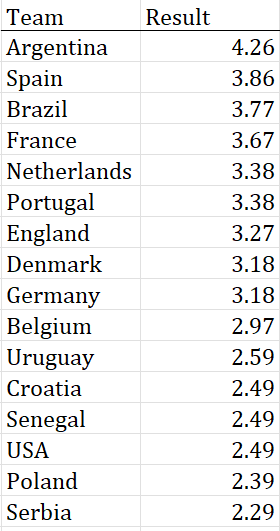
While these results do not take into account potential match ups that could occur before the final, this tally shows the chances of success in the knockout stage based on group stage performance. According to these results, Argentina has the best chance to advance to the semifinals, while Serbia’s chances to advance past the round of 16 are not strong. All in all, the World Cup is always filled with underdog stories and wild finishes, so only time will tell whether these results hold true.
Sources
Cunningham, T. (2022, July 11). 2022 FIFA World Cup Odds. Odds to Win World Cup. https://www.vegasinsider.com/soccer/odds/world-cup/
Mukhopadhyay, A. (2022, April 7). FIFA World Cup 2022: Group Stage Analysis and Prediction. SportzPoint. https://sportzpoint.com/football/fifa-world-cup-2022-group-stage-analysis-and-prediction/
Petty, L. (2018, June 25). Can World Cup group form predict knockout stage success? Pinnacle. https://www.pinnacle.com/en/betting-articles/World-Cup/world-cup-knockout-predictions/EUN2JA3DASRHQN87#:%7E:text=Interestingly%2C%20group%20stage%20form%20can%20also%20be%20used,average%20across%20all%20qualifiers%20for%20the%20knockout%20rounds
Ruthven, G., & Ruthven, G. (2022, April 12). World Cup 2022 predictions for group stage, knockout rounds after draw for Qatar tournament. Sporting News United Kingdom. https://www.sportingnews.com/uk/soccer/news/world-cup-2022-group-winner-predictions-qatar/hqlnkvls6iskficxgtzps53o
About the Author
Zach Shunnarah is a mathematics student at Sewanee. He has experience with relational databases and data analytics research using R coding and programming. Having played sports for 17+ years, his favorite sports are soccer, basketball, and football. He hopes to use data to assess player and team development and performance in order to help teams have the most success in their respective sport.