"College Football Playoff National Championship Trophy" by Thomson20192 is licensed under CC BY-SA 1.0.
The 12-team College Football Playoff in 2025 brings unprecedented uncertainty to predicting the national champion. Using advanced Monte Carlo simulation models, we analyzed CFP bracket outcomes and championship odds for all playoff teams, including favorites Ohio State, Indiana, Georgia, Texas Tech, and Oregon. With the transfer portal reshaping rosters, NIL deals creating free agency dynamics, and conference realignment redrawing college football's competitive landscape, traditional prediction methods fall short. Our data-driven approach uses two independent simulation models—one built on the strength of schedule and adjusted offensive/defensive metrics, the other leveraging Massey Ratings’ win probability—to forecast which teams have the highest likelihood of winning the 2025 College Football Playoff national championship.
Both models simulate the full CFP bracket 10,000 times. Both produce national championship odds and likely quarterfinal, semifinal, and final matchups. But they approach the problem from different angles. Together, they give us a picture of what may happen as the CFP kicks off and progresses.
Model 1: Offense, Defense, and Strength of Schedule
This model uses team performance metrics for offense and defense, adjusted to account for strength of schedule. The idea is a logical one: Reward teams that scored against good defenses and penalize teams that inflated numbers against weak opposition. In this structure:
- Better schedules stress a team’s defense
- Weaker schedules inflate offensive output
- Adjusted metrics should give us information about postseason prospects
Note that raw offensive and defensive metrics were obtained from sports-reference.com. The schedule strength-adjusted metrics for each of the 12 playoff teams are shown in the table below:
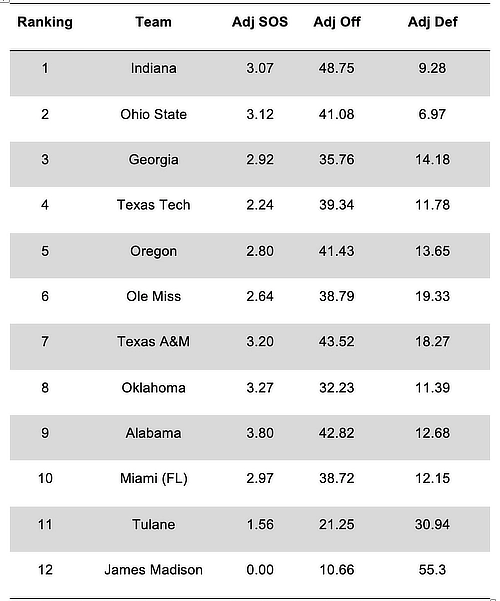 Using these adjusted offensive and defensive metrics, we can then estimate the points scored by one team in a matchup with any of the other CFP teams:
Team Score = RAND() × 1.5 × (Adj Offense + Opponent Adj Defense) / 2
Randomness is sprinkled into the model to account for the variability and uncertainty inherent in sports. Using this model, the CFP bracket was then simulated 10,000 times. The table below shows the percentage of simulations in which each team won the National Championship.
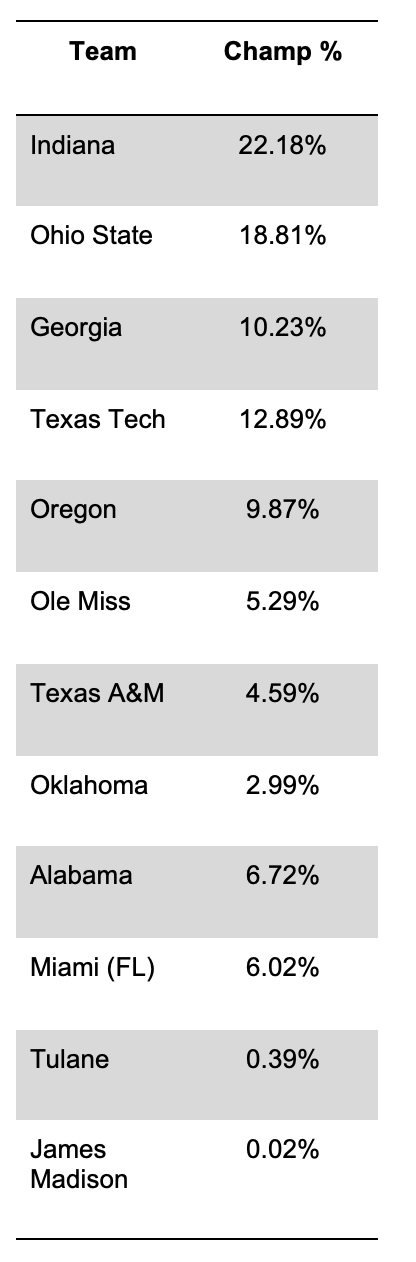 The model suggests that the top four seeded teams account for over 64% of the simulated champions. This contrasts with the 2024 CFP bracket, where two of the top four seeds (Boise State and Arizona State) were given a combined less than 8% chance to win the championship. So far, the decision to straight-seed the bracket rather than giving byes to four conference champions is making a difference.
The most common, simulated title matchup was Indiana versus Ohio State with this match-up occurring in more than 13% of simulations.
This model yielded two main takeaways:
- Five teams dominated the championship distribution
- Playoff “Cinderellas” James Madison and Tulane are massive longshots with little chance to advance
Even with an injection of randomness, the simulated postseason rarely spun toward chaos.
Model 2: A Massey-Based Win Probability Matrix
While Model 1 builds predictive power internally, Model 2 borrows predictive strength from the outside. Instead of projecting scores, Model 2 uses a win probability matrix derived from Massey Ratings (https://masseyratings.com/) for every potential matchup.
Those probabilities become inputs to a tournament simulator that:
- Advances teams probabilistically
- Tracks their likelihood of reaching the quarterfinals, semifinals, final, and winning the National Championship
- Outputs advancement and championship distributions
While Model 1 focused on scoring, Model 2 explores bracket path difficulty.
The Model 2 simulation produced an even more top heavy picture than was seen with Model 1.
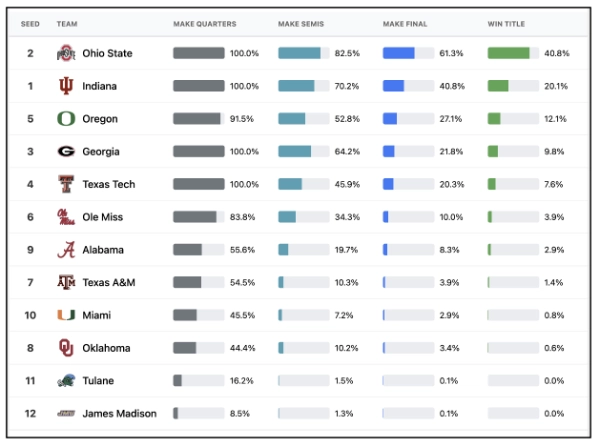 In this model, Ohio State are a strong favorite. The Buckeyes have:
- A more than 82% chance to reach the semifinals
- A more than 61% chance to reach the national championship
- And around a 41% chance to win the national title
Model 2 agreed with Model 1 in projecting Indiana versus Ohio State as the most-frequently occurring National Championship matchup.
Where the Two Models Agree and Disagree
Despite different mechanics, the simulations point to the same conclusion:
Five programs control most of the national title probability.
Indiana, Ohio State, Georgia, Texas Tech, and Oregon dominate both models. They also agree at the bottom: Tulane and James Madison are very likely overmatched.
Despite their similarities, the models do yield some differences. Model 1, grounded in scoring behavior, slightly favors Indiana over Ohio State. Model 2, grounded in opponent-adjusted efficiency via the Massey Ratings, pushes Ohio State far ahead of the field.
About the Authors
Stephen Hill, PhD
Stephen Hill is an Associate Professor of Data Analytics in the Brock School of Business at Samford University. He teaches courses in Advanced Data Analytics and Sports Analytics and serves as Coordinator for the Data Analytics program. His research interest focuses primarily on sports analytics but also includes applications of analytics tools and techniques across a wide range of areas. He is also interested in conducting research related to the improvement of analytics education. He has published in journals such as the Journal of Business Analytics, Decision Sciences Journal of Innovative Education, and others.
Stephen graduated from the University of Alabama with bachelor's and master's degrees in civil engineering and master's and doctoral degrees in operations management. Aside from Samford, he has held faculty positions at Weber State University and the University of North Carolina Wilmington. He is passionate about international education and has taught courses in China, the United Kingdom, Germany, Russia and Peru.
Stephen loves attending sporting events and has been known to venture to far away locales such as Qatar for the 2022 FIFA World Cup and Azerbaijan for the 2020 UEFA Euros. He is a fan of football (both kinds) and can be found cheering for the Alabama Crimson Tide, Samford Bulldogs, and Chelsea. Stephen grew up in Homewood, Alabama, and enjoys travel (50 countries visited so far), spending time with his family, good food, and (of course) watching sports.
Matt Wyatt
Matt Wyatt is a senior in the Sports Industry Program in the Brock School of Business at Samford University. He has worked as a data analyst for baseball and volleyball, and with Samford's Athletics program to support broadcasts on ESPN+.