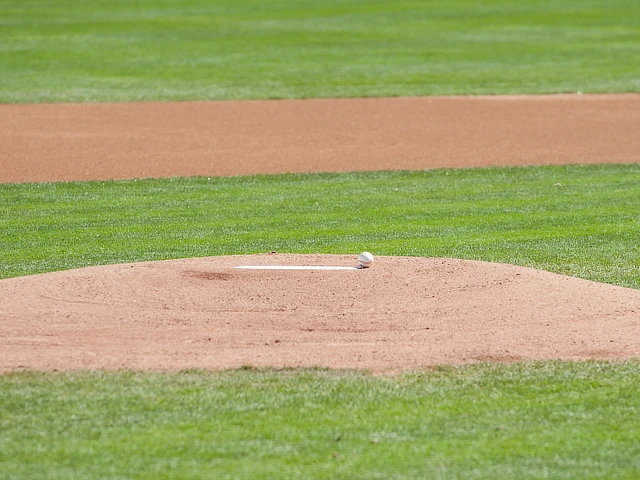
"Baseball on the pitchers mound" by mark6mauno is licensed under CC BY-SA 2.0.
Beginning with the 2023 season, Major League Baseball introduced the pitch clock as part of a series of rule changes to improve pace of play. While the rule has succeeded in shortening game times, it has also sparked concern about its effect on pitcher health. Some have speculated that requiring pitchers to work more quickly could potentially increase fatigue and stress on the arm. In particular, a recent rise in season ending Tommy John surgeries to several star pitchers has fueled the debate over whether the pitch clock has contributed to more injuries.
To investigate if the pitch clock is significantly increasing the rate of pitcher injuries, this analysis uses injury data from the two seasons before implementation (2021-2022) and the two seasons following (2023-2024) to compare overall injury rates as well as specific categories such as elbow injuries and Tommy John surgeries. The proportions were calculated using the total number of games played in the regular season. A z test for proportions was used to determine if the differences in injury rates between the pre and post-implementation periods were statistically significant.
| Injury | 2021-2022 Value | 2023-2024 Value | 2021-2022 Rate | 2023-2024 Rate | P-Value |
|---|---|---|---|---|---|
| Total Injuries | 771 | 713 | 0.158641975 | 0.146707819 | 0.1019 |
| Upper Body | 610 | 585 | 0.125514403 | 0.12037037 | 0.44 |
| Lower Body | 161 | 128 | 0.033127572 | 0.026337449 | 0.04876 |
| Elbow | 163 | 200 | 0.033539095 | 0.041152263 | 0.04778 |
| Tommy John | 58 | 57 | 0.011934156 | 0.011728395 | 0.9253 |
| Neck | 18 | 15 | 0.003703704 | 0.00308642 | 0.6009 |
| Shoulder | 208 | 180 | 0.042798354 | 0.037037037 | 0.1469 |
| Forearm/Flexor | 75 | 67 | 0.015432099 | 0.013786008 | 0.4988 |
| Lat | 22 | 28 | 0.004526749 | 0.005761317 | 0.3949 |
| Oblique | 51 | 39 | 0.010493827 | 0.008024691 | 0.2038 |
| Back | 73 | 56 | 0.015020576 | 0.011522634 | 0.1319 |
| Groin | 38 | 24 | 0.00781893 | 0.004938272 | 0.07447 |
| Hamstring | 42 | 35 | 0.008641975 | 0.007201646 | 0.4232 |
| Knee | 36 | 33 | 0.007407407 | 0.006790123 | 0.717 |
| Calf | 19 | 16 | 0.003909465 | 0.003292181 | 0.6114 |
| Ankle | 20 | 13 | 0.004115226 | 0.002674897 | 0.2222 |
| Foot | 6 | 7 | 0.001234568 | 0.001440329 | 0.7814 |
The results of this analysis found that the introduction of the pitch clock has not been associated with a statistically significant change in the overall rate of pitcher injuries. This finding runs counter to the concern that a faster pace of play would place a greater stress on pitchers’ bodies and lead to more injuries.
However, the results do reveal some effects when looking at specific injuries. Elbow injuries have increased at a statistically significant rate since the implementation of the pitch clock, suggesting that the pitch clock has put an additional strain on pitchers’ arms. At the same time, the rate of Tommy John surgeries has not changed significantly - in fact, the number decreased slightly in the two years after the introduction of the pitch clock. This distinction is important, as it indicates that while elbow injuries have become more common, they have not translated into a higher frequency of season-ending injuries. This finding also runs counter to the idea that the pitch clock is responsible for a greater number of significant elbow injuries in recent memory.
Interestingly, the results also show a statistically significant decline in lower body injuries. This may simply be a result of year-to-year variation, but it is still worth monitoring in future seasons.
Overall, this analysis suggests that the pitch clock has not led to a broad increase in pitcher injuries, though it may be contributing to a rise in less severe elbow problems. Importantly, the most serious injuries, such as Tommy John surgeries, have not become more common since the rule’s implementation. While it is still too early to know the long-term effects, these results provide some reassurance that the pitch clock has not been as damaging to pitcher health as some initially feared.
About the Author
Isaac Rhee is a rising junior at Northwestern University majoring in Statistics and minoring in Data Science. He is interested in pursuing a career in sports analytics.
