
Should all statistics be interpreted equally? Can we assume that the highest batting average, highest OPS, and lowest ERA are always the best? In the sabermetrics world of baseball, the answer to these questions is a firm no. This is due to factors that differ for each team, specifically ballpark run environment (park factor) and league-wide averages. Accounting for these factors has led to the advanced statistics OPS+ and ERA+, which demonstrate that surface-level stats do not tell the full story.
For example, in 2017 the Colorado Rockies made the playoffs while finishing second in the National League in OPS. However, after adjusting for Coors Field’s run environment and the league-average OPS, the Rockies ranked 11th in OPS+. Conversely, they finished ninth in the National League in ERA but fifth in ERA+ (2017 Major League Baseball Team Statistics). This suggests that although the Rockies appeared above average in OPS and below average in ERA, their playoff run should be credited more to their pitching performance than to their offensive output.
Applications to Softball
Decades of baseball research have identified ways for teams to create competitive advantages. Once one team discovers an edge, others replicate it as effectively as possible until the advantage disappears. Metrics such as ERA+ and OPS+ emerged in the 1980s as early tools for evaluating team performance (Heipp, 2014). However, these metrics are not being universally applied in softball, even though the necessary data is readily available.
Before implementing these modern statistics in NCAA softball, a couple questions must be addressed. Does park factor meaningfully apply to softball? And how can MLB’s park factor formula be adapted to NCAA softball, given differences in the number of conference games and the frequency of cancellations? Answering these questions will determine if OPS+ and ERA+ are good performance evaluators in softball, too.
Project Details
To answer these questions, data was gathered from 643 Charts, team websites, and conference websites to determine 2025 park factors for all Power Four conferences, Group of Five conferences, and the Southern Conference. These park factors, along with conference averages, determined 2025 OPS+ and ERA+ for each team (118 teams total).
Before going any further, it is essential to define the formulas used to calculate these statistics. In Major League Baseball, because 81 games are played at home and 81 games are played away from home, park factor is determined as follows:
![]()
To adjust this formula to NCAA softball, the following formula was used to account for differences in games played:
![]()
To calculate OPS+:

To calculate ERA+:
![]()
A park factor of 100 represents a neutral run environment. Values above 100 indicate increasingly hitter-friendly conditions, while values below 100 indicate increasingly pitcher-friendly conditions.
An OPS+ or ERA+ of 100 represents the conference average. Values above 100 are better than average, and values below 100 are worse than average.
Obstacles in Data Collection Process
The biggest obstacle in this project was that the necessary data was not housed in one place. Runs scored and allowed at home and away for each team had to be gathered from team websites, which varied in format. These park factor inputs had to be calculated manually, which increased the time required to validate the work. Additionally, OPS+ and ERA+ needed to be calculated using different websites. 643 Charts accounts for plate appearances, a necessary input in determining weights for conference averages. However, 643 Charts does not display ERA, which is an essential input for ERA+. Furthermore, 643 Charts’ conference statistics include tournament games, while team and conference websites do not. This resulted in data that was not as uniform as preferred, but since each team plays only a handful of tournament games, the consequences appear minimal.
Outcomes
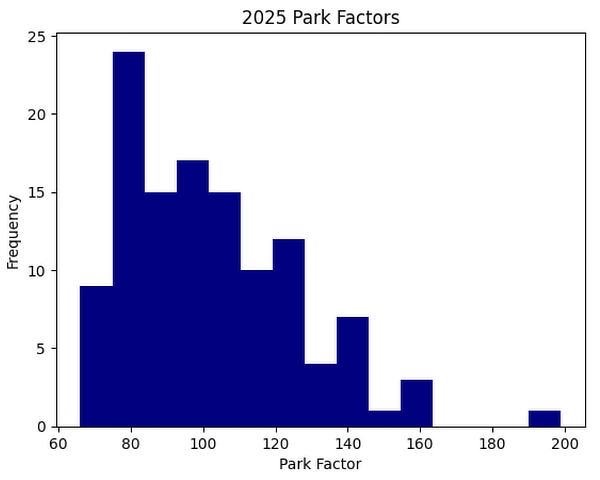 For the 2025 season, park factors for Power Four, Group of Five, and Southern Conference teams ranged from 66 to 199. The average park factor was 101.99, the median was 99.5, and the mode was 79 (six occurrences). The mode being significantly lower is likely a random occurrence, as the mode is the least stable measure of central tendency. Five other park factors appeared four times, and nine park factors appeared three times. There is no reason to believe that pitcher-friendly parks are the most common. There were 59 parks with a park factor below 100 and 57 with a park factor above 100, which is not enough of a difference to draw a meaningful conclusion. The standard deviation is 24.13, which suggests that most values fall roughly within the 75–125 range. The histogram is slightly right-skewed due to a few outliers (155, 158, and 199).
It is also worth noting that Colorado State, which plays at over 5,000 feet above sea level, had a 2025 park factor of 158 and was considered an outlier in the dataset.
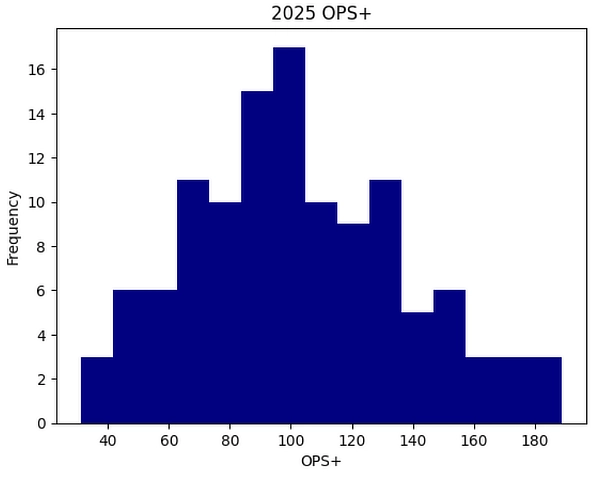
For the same teams, 2025 team OPS+ ranged from 31 to 189. The average team OPS+ was 102.49, the median was 100.5, and the mode was 104. The standard deviation was 35.48, indicating substantial variation in offensive performance among teams. Because OPS+ is scaled so that 100 represents conference-average offense, both the mean and median being near 100 suggest that the distribution is centered close to the expected baseline.
The histogram is slightly right-skewed, largely due to several high-end offensive outliers, although there are also a few low-end outliers. The relatively large standard deviation reflects the wide range between weaker offenses and the most productive lineups. Overall, the distribution indicates that while most teams cluster near conference average, a handful of elite offenses pull the upper tail of the distribution upward.
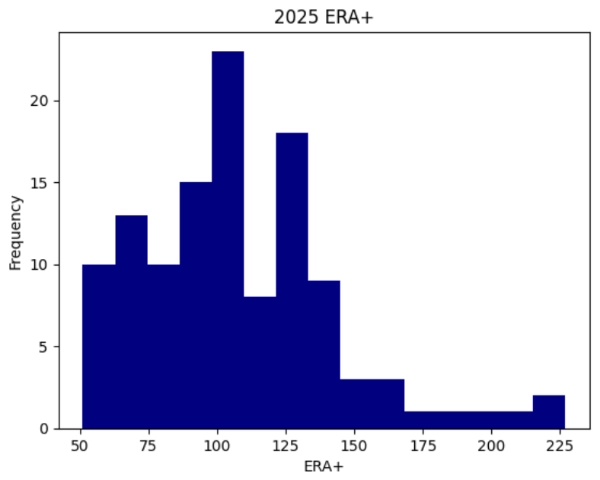 The histogram for 2025 team ERA+ appears more similar to the 2025 park factor histogram, with values ranging from 51 to 227. The average ERA+ was 107.14, the median was 103, and the mode was 107. The standard deviation was 35.07, indicating considerable variation in pitching performance among teams. Because ERA+ is scaled so that 100 represents conference-average run prevention, both the mean and median being above 100 suggest that a larger share of teams performed better than the baseline.
The histogram is right-skewed, primarily due to several high-end outliers representing elite pitching staffs. While there are some lower ERA+ values, the upper tail of the distribution extends further, which pulls the mean above the median.
Conclusion
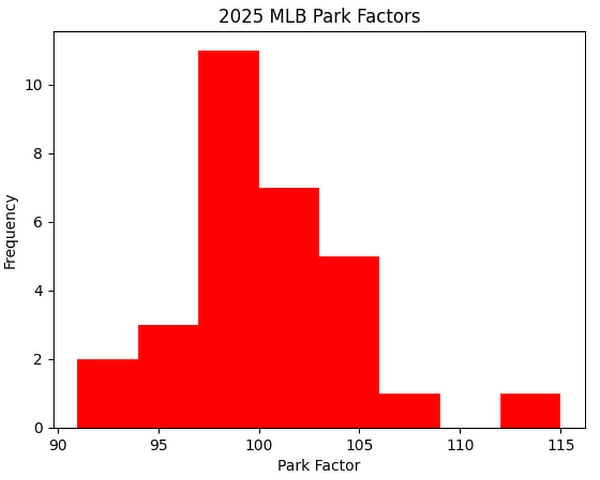
At the beginning of this post, two questions were posed. The first was: Does park factor meaningfully apply to softball? By examining both single-season and multi-season data, the answer appears to be yes. In 2025, MLB park factors ranged from 91 to 115, albeit across many more games (Statcast Park Factors). NCAA softball park factors showed greater variation than those observed in MLB. This greater variation suggests that accounting for park effects may be even more important when evaluating team performance in NCAA softball.
 The second question was: How can MLB’s park factor formula be adapted to NCAA softball, given differences in the number of conference games and the frequency of cancellations? This was addressed by adjusting the park factor formula to consider average runs scored rather than total runs, allowing for the calculation of team OPS+ and ERA+, which appear to be meaningful indicators of overall team performance. Although Samford finished the 2025 season with the best OPS and the fifth-ranked ERA in the Southern Conference, they ranked third overall in both OPS+ and ERA+, aligning with the team’s third-place conference finish.
About the Author
Tucker Whittington is an MBA student concentrating in Sports Business and Data Analytics and serves as the lead analyst for Samford University’s softball team. He is from Baton Rouge, Louisiana, and earned his undergraduate degree in Finance from Auburn University. He is passionate about the art of pitching in baseball and softball, with a focus on pitch design, pitch sequencing, and pitcher deception.
To contact him, email jtwhitt@fastmail.fm.
References
- Heipp, B. (2014, March 11). Of Pluses and Minuses. The Hardball Times. https://tht.fangraphs.com/of-pluses-and-minuses/
- MLB Advanced Media, LP. (n.d.). Statcast Park Factors. Baseball Savant. https://baseballsavant.mlb.com/leaderboard/statcast-park-factors
- OpenAI. (2026). ChatGPT (Mar 5 version) [Large language model]. https://chat.openai.com/chat
- Sports Reference. (n.d.). 2017 Major League Baseball Team Statistics. Baseball Reference. https://www.baseball-reference.com/leagues/majors/2017.shtml