
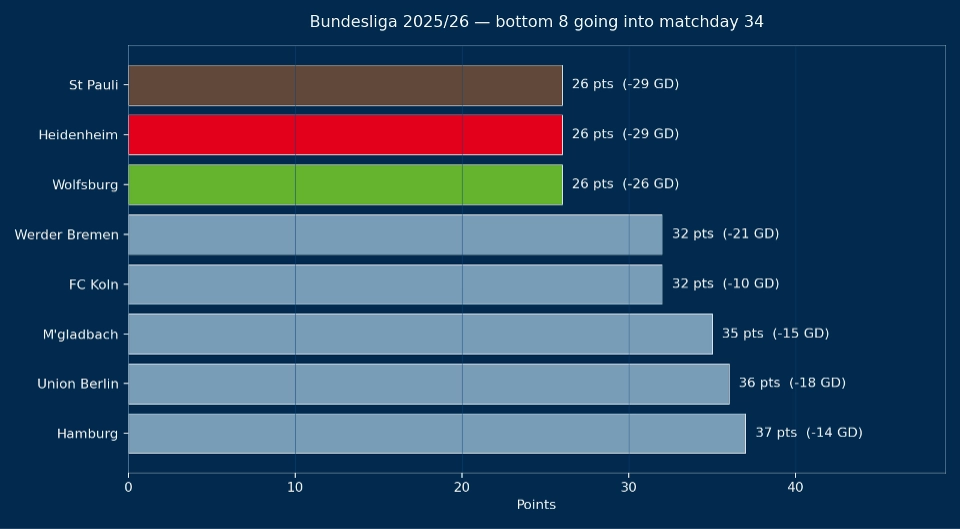
Going into the final weekend of the 2025/2026 Bundesliga season, three teams sit on exactly 26 points: Wolfsburg, Heidenheim, and St Pauli. Goal differential puts Wolfsburg in 16th place and goals scored puts Heidenheim in 17th ahead of St. Pauli. Relegation from the Bundesliga is a bit different than what you might be used to if you follow English football leagues. In the Bundesliga, the 16th place team plays a relegation playoff against the 3rd place finisher from the Bundesliga 2. The 17th and 18th placed teams are directly relegated to the second division. Two matches on the final day of the season will decide which teams will be directly relegated and which team will have a chance to survive via the relegation playoff.
I have a soft spot in my heart for Heidenheim (I did some short-term teaching at a university there several years ago and was able to attend a Heidenheim home match), so I wanted to get a sense of the likelihood that Heidenheim will remain in the Bundesliga. To do so, I trained an Elo model with a Poisson goal layer on 30 years of Bundesliga results.
An Elo ratings model gives you a team-strength number. You can then utilize the Poisson distribution to estimate a goals-scored distribution for any match-up of two teams. Data from 30 Bundesliga seasons was used to generate team Elo ratings. I update Elo with a goal-margin K-factor, a home bonus of 65 Elo points, and a one-third regression to the mean every July (offseason). Then I fit two Poisson Generalized Linear Models on the resulting (elo_diff, home_goals) and (elo_diff, away_goals) pairs.
The fitted model intercepts are a nice sanity check that yield an average of approximately1.63 home goals per game and 1.23 away goals per game. Real Bundesliga averages are about 1.6 and 1.3. On a 1X2 backtest the model lands at roughly 55% accuracy and 0.97 log-loss. This performance is solid and in line with bookmaker odds.
Let’s take a look at the two matches on the last matchday that matter:
- Heidenheim hosts Mainz. Mainz is in 10th place and is safe from relegation.
- St Pauli hosts Wolfsburg. Two of the tied teams playing each other.
The chart below is a heatmap of the scoreline probabilities for both of these matches using our model.
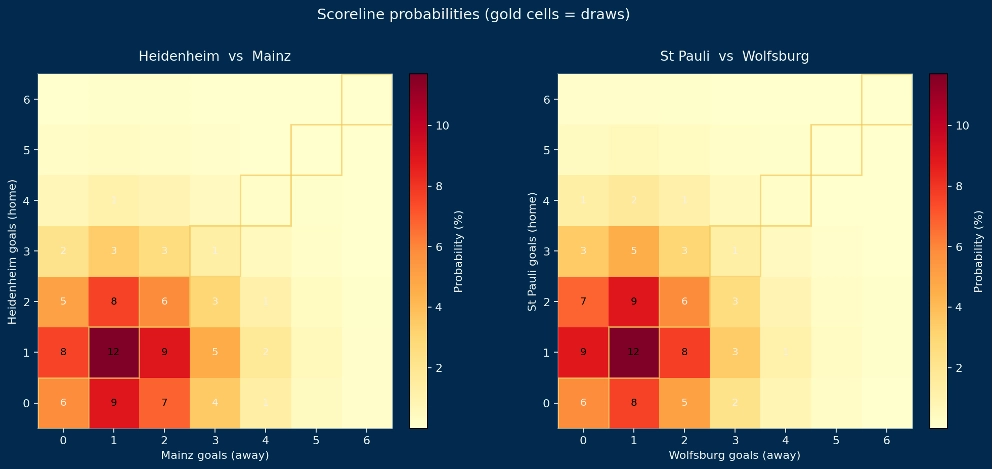
From these goal distributions we can extract the win/draw/loss chances for each match: Heidenheim vs Mainz: 32.5% / 24.9% / 42.6%. Mainz is slightly favored even on the road. St Pauli vs Wolfsburg: 42.2% / 24.9% / 32.9%, with the home side favored. Most likely scoreline in both matches is: 1–1. To get these probabilities, I enumerated every pair of scorelines up to 10–10 in each game, weighted by the Poisson joint probability, applied points, then broke ties by goal difference and then goals scored.
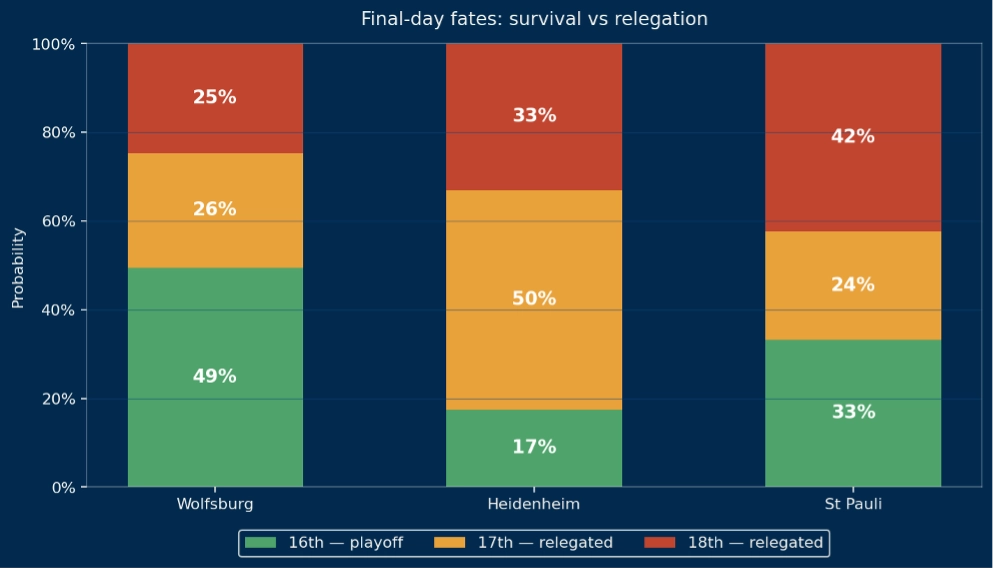
Wolfsburg is the most likely survivor (49.4%). Heidenheim is the most likely 17th place finisher, and St Pauli is the most likely to finish last.
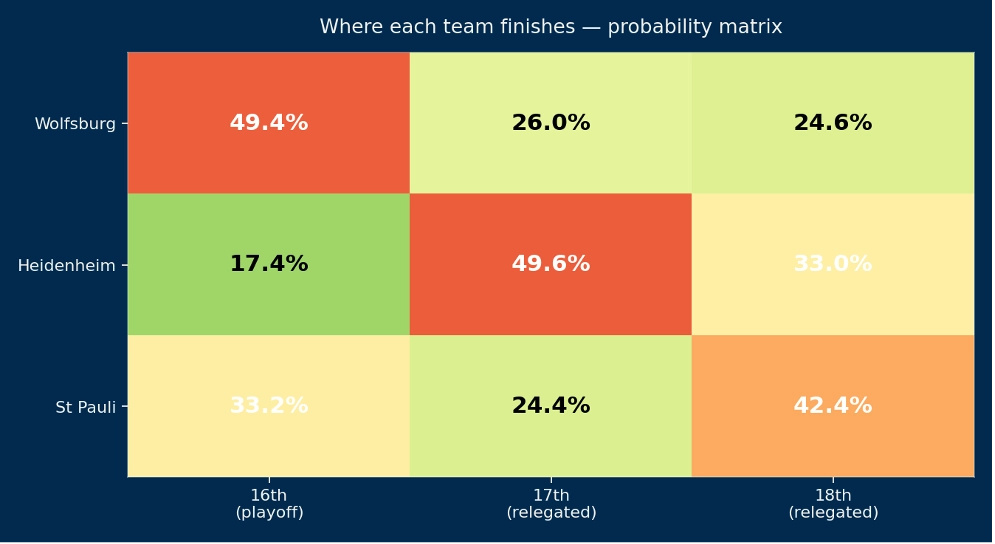
Wolfsburg gets to their 49.4% chance of finishing in 16th on the back of a three-goal goal-difference cushion that keeps them ahead of the other two teams when nobody wins. Heidenheim is wedged in the middle of the tiebreakers, which is why their 17th place probability is 50%. St Pauli is the cleanest 18th place candidate because their goals-for is so far behind at 28 to Heidenheim's 41. Note that these probabilities seem well-calibrated when we compare them
What does the path to 16th place look like for each team?
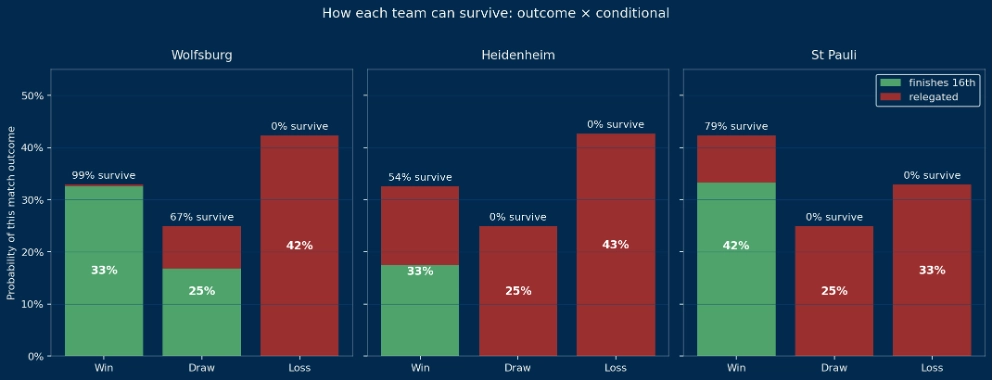
The Wolfsburg loss column is empty because Wolfsburg's opponent is St Pauli. If Wolfsburg loses, St Pauli takes three points and jumps them outright. Any goal differential cushion becomes irrelevant once the points gap exists. Where the goal differential cushion for Wolfsburg does work is in the draw column: If Wolfsburg draws it (obviously) implies that St Pauli draws. Both teams would finish on 27 points and Wolfsburg's goal differential pulls them ahead.
Heidenheim and St Pauli have completely empty draw and loss columns. There is no version of those outcomes where either team finishes 16th. They need to win. And even winning isn't automatic. Heidenheim's conditional survival on a win is 54%. The other 46% is mostly the Wolfsburg-also-wins branch and where Wolfsburg's goal differential lead carries through. For Heidenheim to beat that with a win of their own, they'd need to outscore Wolfsburg by three more goals than they did. The Poisson distribution suggests that this is possible, but rare.
St Pauli's conditional survival on a win is 79%. Much higher because the team they’d beat in that scenario is Wolfsburg, so they’d taking points off their direct competitor. The 21% gap is Heidenheim winning by a larger margin than St. Pauli.
Before we close, let’s address a few assumptions of these models and how the assumptions may impact the results. We assume that the two matches are completely independent in the model. In practice this may not be strictly truly. Although the match kickoffs are simultaneous, scores leak between locker rooms and late-game tactics may change to react to what's happening elsewhere. We do not capture this in our model.
Also worth noting: the Poisson distributions are independent across teams. Real football has a small correlation in low scores (0–0 and 1–1 are slightly more common than independent Poisson predicts). This can be adjusted, but was not done in this work.
Finally, Mainz has nothing to play for. The model treats them as the team they've been across their 33 Bundesliga games. If they take their foot off the gas, Heidenheim's win probability likely creeps up by some amount that is not reflected in the data. Heidenheim will also be extremely motivated and playing for their survival.
With those caveats sitting where they are, the matrix above is where the model lands. We'll know in 90 minutes.
Data: football-data.co.uk, 1995/96 through 2025/26. Model: Elo with goal-margin K-factor, season regression, and Poisson GLM goal layer.