


The 2026 World Cup wrapped up with Spain lifting the trophy, and now the focus shifts to what all that data tells us about soccer performance going forward. Over 104 matches across the group stages and knockout rounds, nearly every imaginable soccer metric was recorded and available for analysis. The question we wanted answered: which of these metrics actually matter when winning is everything, and what do the answers tell us about the sport as teams prepare for the Premier League season about to kick off?
This analysis reveals something worth paying attention to. The metrics that predict success at the World Cup don't always behave the same way they do in domestic leagues. More importantly, one finding stands out: the role of passing volume in creating offensive opportunities proved far more significant than we expected. That distinction could reshape how we think about team performance heading into the new Premier League season.
Methodology
We conducted three separate empirical studies using regression analysis, examining relationships between different variables across the 48 teams and 104 matches at the 2026 World Cup. All statistical data came from Sofascore, with FIFA rankings obtained directly from the official FIFA website.
Study 1 analyzed 16 different quantitative variables for all 48 teams, examining 44 different variable combinations to determine which statistics correlate with winning, scoring goals, and gaining points. Study 2 replicated previous research analyzing the relationship between total passes and expected goals, comparing World Cup findings to 12 seasons of Premier League data. Study 3 examined stoppage time distribution to check for potential referee bias toward higher-ranked teams or teams that advanced further, finding no statistically significant relationship—confirming that our other findings aren't skewed by such bias.
R2 values measure the percentage of variance in a dependent variable explained by the independent variable. A higher R2 indicates a stronger relationship. In soccer analysis, R2 values rarely exceed 0.6, but values above 0.5 represent substantial relationships given the sport's complexity. For statistical significance, we used a p-value threshold of 0.05 (approximately 0.1 R2), meaning the relationship had only a 5% probability of occurring by chance.
Study 1: What Matters Most at the World Cup
The 2026 World Cup was an opportunity to test which team statistics actually drive success. Every match provided dozens of data points: possession percentage, distance covered, expected goals, shots, passes, fouls, points, goals scored, goals conceded, and goal difference. We analyzed 16 of these variables across 44 different combinations to see which had the strongest relationships with winning and scoring.
Our core findings: FIFA rank and goal difference showed the strongest relationship (R2 = 0.57), meaning a team's pre-tournament ranking explained 57% of the variation in how many more goals they scored than they conceded. This makes intuitive sense—better teams tend to dominate. Shots on goal and goals scored also showed a strong relationship (R2 = 0.57), confirming that putting shots on target matters more than just attempting shots. FIFA rank and expected goals (R2 = 0.56) and FIFA rank and points (R2 = 0.56) rounded out the strongest relationships.
Notably, distance covered and fouls proved almost meaningless. Teams that ran more didn't necessarily win more games or score more goals. Scotland ranked 7th in distance covered but ranked 36th in goal difference per match. Meanwhile, running a lot can look visually impressive, but it alone won't win you a game. The same held for fouls—no relationship existed between how many fouls a team committed and their points total. Referees didn't favor clean teams or penalize aggressive ones in any measurable way.
To understand which variables most reliably predicted success, we examined predictor variables—independent variables that explained variation in points, goal difference, and goals scored.
Understanding the Key Variables
FIFA Rank: A team's ranking based on recent form, calculated by FIFA using a points system that weighs match importance, results, and expected outcomes based on opponents' rankings. Updated after each match. Higher-ranked teams are generally stronger.
Expected Goals (xG): A metric measuring how many goals a team should have scored based on the number and quality of shots taken. It's a probability-based measure that reveals expected offensive output regardless of actual finishing quality.
Possession %: The percentage of game time a team controlled the ball. Some teams, like Spain, prioritize possession and build from the back. Others absorb pressure and attack on the counter. High possession doesn't guarantee goals.
Shots on Goal: Shots that either went in or would have gone in if not stopped by the goalkeeper or defender. More specific than total shots, but still not a perfect predictor of goals.
Goal Difference: Goals scored minus goals conceded. Serves as a measure of dominance throughout a tournament. A strong positive goal difference suggests consistent control.
Distance Covered: Total kilometers run by a team during a match. Running a lot looks impressive but doesn't directly correlate with winning.
[For complete definitions of all 16 variables analyzed in this study, see the Appendix.]
FIFA Rank as a Predictor of Success
FIFA rank served as a predictor variable 11 times in our analysis—25% of all combinations studied. Out of those 11 combinations, 8 showed statistically significant strong relationships, 1 showed moderate strength, and only 2 were weak. The strongest correlation was with goal difference (R2 = 0.57), followed by expected goals (R2 = 0.56). Other strong relationships included points, possession, passes, shots on goal, and corner kicks.
The weakest relationships were with fouls (R2 = 0.004) and distance covered (R2 = 0.03). A team's ranking tells you almost nothing about how many fouls they'll commit or how far they'll run. Argentina entered as the top-ranked team but finished 42nd in fouls per match and 32nd in distance covered per match. Being the best team in the world doesn't make you run more or foul less—it makes you win more.
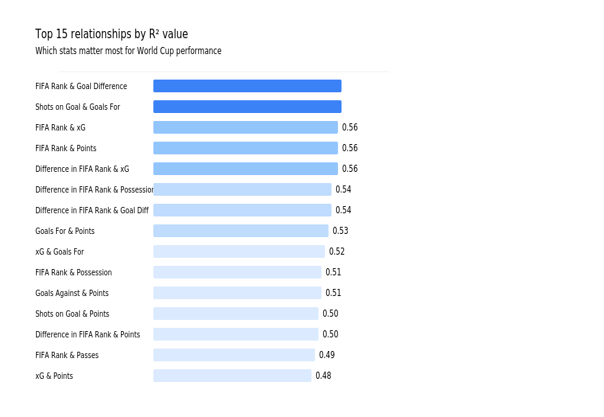
Figure 1: Top 15 strongest relationships by R2 value. FIFA rank and goal difference showed the strongest predictive power at 0.57, indicating that pre-tournament rankings explained 57% of the variation in goal difference throughout the tournament.
Schedule Strength and Performance
Beyond absolute ranking, we examined whether teams benefited from easier schedules. The difference between a team's FIFA rank and their opponents' average ranking proved highly predictive. When a team was ranked significantly above their average opponent, they produced more offensive output, retained more possession, and gained more points.
Germany, ranked 10th, had the easiest schedule relative to their ranking and produced the 5th most expected goals per match. They finished 2nd in average goal difference per match, including a 7-1 victory over Curaçao. Yet they were eliminated in the round of 32—a reminder that good matchups don't guarantee deep tournament runs.
Out of 8 combinations using schedule strength as a predictor, 7 showed statistically significant strong relationships. Teams with easier schedules relative to their own ranking generally outperformed those with tougher matchups. But again, anomalies surfaced regularly enough to matter.
What Actually Leads to Winning
Points—3 for a win, 1 for a draw, 0 for a loss—represent the ultimate objective. We examined which statistics best predicted point accumulation. Goals for and shots on goal were the strongest predictors (both around R2 = 0.5+), which seems obvious but requires qualification: the quality of those goals and shots matters far more than volume. Spain won the tournament ranking 15th in goals per match. Senegal ranked 3rd in goals per match but finished 35th in points per match. They scored but couldn't consistently win.
Passes (R2 = 0.44), possession (R2 = 0.41), and expected goals (R2 = 0.48) all showed moderate predictive power for points, but none were reliable guarantees. France ranked 3rd in goals and 5th in points. Paraguay had only 7 shots in their game against Turkey, who had 32 shots, but won 1-0. Total shots, by themselves, only explained 30% of variation in points—quality beats quantity.
Corner kicks showed a weak relationship with points (R2 = 0.18). Getting more corners helped in some situations but wasn't a reliable path to victory. Distance covered and fouls showed essentially no relationship with points. These statistics might reflect your team's approach, but they don't predict your results.
Study 2: The Passing Paradox—56% vs 85%
This is where the story gets interesting.
In recent years, soccer has undergone a fundamental tactical shift toward possession-based play. Teams build from the back, complete short passes in crowded spaces, and try to control the game through ball possession. The theory is simple: if you have the ball more, you'll create more scoring opportunities. This philosophy dominates modern coaching—from Barcelona's style to how most successful Premier League teams operate.
One of us published previous research analyzing the relationship between total passes and expected goals across 12 seasons of English Premier League data (2013/14 to 2025/26)—that's 4,560 matches. The finding: total passes explained 56% of the variation in expected goals created. In other words, passing volume accounted for a bit more than half of the offensive output. The other 44% came from other factors: the quality of passes, player skill, tactical awareness, and tactical variations like counterattacking or gegenpressing.
Given that pattern, we expected the World Cup analysis would show a similar or possibly weaker relationship. World Cup games are approached tactically differently than domestic league matches. Teams are more conservative, playing to avoid elimination. Star-dependent squads try to get the ball to their best players efficiently rather than through long passing sequences. With 104 World Cup matches instead of 4,560 Premier League matches, we also had a much smaller sample size.
We were wrong.
At the 2026 World Cup, total passes explained 85% of the variation in expected goals. That's a 29-percentage-point jump from the Premier League.
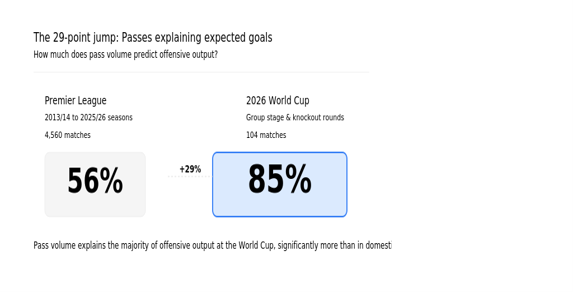
Figure 2: The 56% to 85% jump. Pass volume's predictive power for expected goals showed a dramatic increase at the World Cup compared to Premier League data, suggesting that high-stakes tournaments reveal underlying relationships more clearly.
The coefficient tells us that every 276 passes resulted in 1.0 expected goal across the entire tournament. Spain, the eventual champions, led the World Cup in total passes and ranked 2nd in total expected goals, lifting the trophy after the final. Their philosophy of possession, short passes, and building play methodically paid off against teams using other approaches.
Why Did Passing Volume Matter More at the World Cup?
This 29-point jump is worth understanding because it reveals something fundamental about how soccer works. We think several factors explain the difference:
First, variance. The Premier League consists of 20 teams that have converged on similar quality levels over time. They're all well-coached, well-funded, and tactically sophisticated. The World Cup spans from elite teams like Spain to smaller nations with far fewer resources. This massive variance in team quality makes correlations show up more clearly. When your independent variable (total passes) has extreme values—some teams passing 2,000+ times throughout the tournament, others under 1,000—relationships with dependent variables tend to strengthen mathematically, even if the underlying relationship is identical.
Second, tactical purity. The World Cup's short timeframe forces teams to execute their gameplan precisely. There's no 9-month season to adapt tactics, deal with injuries, or drift away from your philosophy. Spain played possession-heavy soccer because that's what they do, consistently. In the Premier League, teams rotate, manage fatigue, and experiment across 38 matches. That tactical variation introduces noise into the data.
Third, stakes. Every World Cup match is crucial. Teams can't afford to experiment or rotate. Players execute their system with maximum precision because elimination is immediate. In contrast, a Premier League team might coast in a match against a weak opponent, or rest players. That consistency in intensity means the World Cup reveals the true relationship between variables more clearly.
The World Cup didn't reveal a new truth—passing volume matters in the Premier League too. Rather, it showed us the truth more clearly. When noise is removed and stakes are maximum, pass volume emerges as the dominant predictor of offensive output. Teams that control possession and complete passes create more scoring opportunities. For most of the tournament, this advantage compounds. Spain's philosophy worked precisely because they committed to it completely.
Yet anomalies existed. Canada ranked 18th in total passes but finished 8th in total expected goals, suggesting efficiency can occasionally overcome volume. However, Canada's 6-0 group victory against Qatar (who had two players sent off) inflated their expected goals average artificially. When we look at the efficiency metric of passes per expected goal, context matters as much as the number.
The 85% finding is striking precisely because it's so clean. The relationship was nearly one-directional: teams that didn't pass a lot couldn't generate high expected goals, but teams that passed extensively almost always created opportunities. This tells us that in the World Cup's high-stakes environment, passing volume is the fundamental building block of offensive threat.
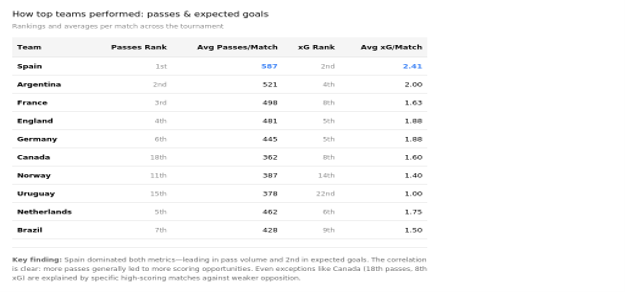
Figure 3: Key teams' pass volume and expected goals. Spain's dominance in both metrics (1st passes, 2nd xG) exemplifies the strong correlation. Notice how the relationship holds across most teams: higher pass ranking generally corresponds to higher xG ranking.
What This Means for the Premier League Season
The 2026 World Cup data tells us something worth paying attention to as the Premier League season begins. Higher-ranked teams with superior statistics in key areas—possession, passes, shots on goal, expected goals—generally accumulate more points and advance further. This isn't revolutionary, but it's confirmed at soccer's highest level.
More specifically, the dominant finding should reshape how we evaluate Premier League squads. Pass volume and possession matter. They matter a lot. Spain won the World Cup because they led in total passes and ranked 2nd in expected goals. They didn't win through luck or individual brilliance—they won through control. If you're trying to predict which Premier League teams will thrive this season, watch which teams prioritize ball possession and passing volume. These metrics correlate strongly with creating scoring opportunities.
Distance covered and fouls matter far less than fans often think. Running hard looks impressive on the highlight reel. Playing a clean game seems disciplined. But in terms of actually winning matches, these variables barely register. Managers shouldn't sacrifice tactical coherence chasing higher distance covered or fewer fouls.
Schedule strength—facing easier opponents relative to a team's own ranking—does influence performance. But anomalies happen regularly. Expect some lower-ranked teams to exceed expectations and some higher-ranked teams to disappoint. The data shows probability, not destiny.
In a sport where every goal matters and tournaments are won by single objectives, it's tempting to search for hidden patterns or clever tactics that bypass the fundamentals. But the World Cup data suggests the opposite: the teams that master the fundamentals—high possession, efficient passing, quality finishing—win the trophies. As the Premier League begins and 20 teams compete over 38 matches, those same fundamentals will likely determine who finishes on top.
References
Sofascore. (n.d.). Football live scores, fixtures, and results. Retrieved July 19, 2026, from https://www.sofascore.com/
FIFA. (n.d.). FIFA/Coca-Cola men's world ranking. Retrieved July 19, 2026, from https://inside.fifa.com/fifa-world-ranking/men
Editorial Note
This article was developed and refined in collaboration with Claude, an AI assistant used as an editorial tool by the Center for Sports Analytics at Samford University. Claude assisted in restructuring the analysis for clarity, identifying key findings, suggesting visual improvements, and strengthening the narrative connection to current sports contexts. The underlying statistical analysis, methodology, and all data interpretation remain the original work of author Justin McDowell.
Appendix: Complete Variable Definitions
This appendix provides complete definitions of all 16 variables analyzed in Study 1. Definitions are listed in the order they appear in the analysis.
FIFA Rank
A team's FIFA ranking is its ranking in the world among all other teams across the globe. FIFA rankings are based on recent form and are calculated using a points system, updated after each match. The calculation weighs match importance, the actual result of the match, and the expected result based on the opponents' rankings. Coming into the 2026 World Cup, Argentina (winner of the 2022 World Cup and 2024 Copa America) was ranked 1st, with 2024 Euro champions Spain and 2022 World Cup runner-ups France following right behind. New Zealand was the lowest-ranked team at 85th. For this study, the most recent rankings just before the World Cup started were used. FIFA rankings were obtained from the official FIFA website.
Possession %
Possession percentage is the percentage of the game in which a team was in possession of the ball. Though simple in concept, it goes much deeper for managers and players. Some teams, like Spain, prioritize the ball and aim for high possession. Other teams, particularly those with less technical quality, will absorb pressure and try to be lethal on the counterattack, resulting in lower possession. Both methods can be effective if executed correctly. High possession doesn't guarantee goals, and low possession doesn't guarantee fewer goals. The contrary also holds true. Possession statistics were collected from Sofascore.
Distance Covered
Distance covered is a metric of how much distance, in kilometers, a team ran and covered during the match. It's a straightforward measurement with few caveats, though note that the study does not mark teams that received red cards. A red card would theoretically reduce distance covered as the team would have one fewer player on the field. Distance covered numbers were collected from Sofascore.
xG (Expected Goals)
Expected goals (xG) measures how many goals a team should have scored on average based on the number and quality of shots taken. It's a probability-based metric showing how good a team should have been on the offensive end. However, because it's based on probabilities, it doesn't tell the complete story of actual production. More shots don't necessarily result in higher xG, and fewer shots don't necessarily result in lower xG. Teams regularly overperform or underperform their xG. For example, a team could have 2.47 xG versus an opponent's 0.81 xG but still lose 1-3. xG predicts expected goals, but finishing quality, goalkeeper performance, and defensive ability can create large gaps between expected and actual scoring. xG numbers were collected from Sofascore.
Shots
A shot in soccer is any intentional attempt to strike the ball towards the goal with the purpose of scoring. However, shots are not a direct measure of goals. More shots don't mean more goals, and fewer shots don't mean fewer goals. A team needs just one shot to score, while another team could accumulate 25 shots without scoring. Shots were collected from Sofascore.
Shots on Goal (SOG)
Shots on goal, or shots on target, are shots that either go in the net or would have gone in if not stopped by the goalkeeper or a defender. Like shots, shots on target aren't a direct measure of goals. More shots on goal doesn't mean more goals, and less doesn't mean fewer. A team with 15 shots on goal could finish with zero goals, while an opponent with 2 shots on goal could score twice. Finishing quality matters significantly. Shots on goal were collected from Sofascore.
Corner Kicks (CKs)
A corner kick is awarded when the ball goes out of play past the opposing team's goal line and was last touched by an opponent. Corner kicks can result in goals, but if defended effectively, they can also spark counterattacks. Some teams prioritize corners and set pieces extensively, while others focus less on them. Teams with height advantages, like Australia, pursue corners aggressively. Shorter teams may not emphasize them as much. Corner kicks were collected from Sofascore.
Fouls
Fouls result in either a free kick or penalty kick for the opposing team. Harsher fouls can warrant yellow or red cards, though these are not included in this study. Teams defending frequently or more aggressively might commit more fouls per game. Teams possessing the ball extensively might commit fewer fouls. Fouls were collected from Sofascore.
Passes
Passes is a simple statistic but one that leads to in-depth analysis of many other variables. More passes usually correlates with higher possession, but not always. More passes doesn't always result in more offensive production. A goal can come from a 40-pass buildup or from just 3 passes. The importance of pass volume is subjective and varies by team. Passes were collected from Sofascore.
Points
Points are awarded as 3 for a win, 1 for a draw, and 0 for a loss. In domestic leagues, points are the ultimate measure—the team with the most points at season's end wins the trophy. At the World Cup, it's similar but not identical. The World Cup winner will have accumulated the most points, but a team eliminated in the round of 32 could have more points than a team eliminated in the round of 16. In tournament formats, points don't guarantee trophy wins, though generally, teams with higher points advance further. Points are determined by teams' results collected from Sofascore.
Goals For (GF) and Goals Against (GA)
Goals For (GF) is the number of goals a team scores. Goals Against (GA) is the number of goals conceded. Teams that score many goals should expect to win, but this assumes strong defense too. A team scoring 3 goals could still lose 3-4 or draw 3-3. The objective of this study was to determine what leads to more goals scored and more goals conceded. Goals were collected from Sofascore.
Goal Difference (GD)
Goal difference is goals for minus goals against. It can be positive or negative. In the group stages, goal difference serves as the next tiebreaker after head-to-head results. After a tournament concludes, goal difference reveals whether a team was dominant, mediocre, or poor. Germany's 2014 World Cup goal difference was +14 (+2.0 per match), highlighting their dominance. Qatar's 2022 goal difference was -6 (-2.0 per match), reflecting their disappointing host nation performance. Winning games is most important, but high goal difference shows just how good a team truly was.
Opponents' Average FIFA Rank
Using the same FIFA rankings discussed earlier (rankings from before the World Cup), the average FIFA ranking of each team's opponents was calculated. In theory, higher-ranked teams should face slightly easier schedules, particularly in group stages. Chaos in knockout rounds can create varied difficulty levels. This metric helps determine if schedule strength affects other statistics.
Difference in FIFA Rank and Opponent's Average FIFA Rank
To determine if a team's schedule is 'easier' or 'harder' relative to their own ranking, the difference between a team's FIFA rank and their opponents' average FIFA rank was calculated. A positive difference means the team ranks above their average opponent, implying an easier relative schedule. A negative difference implies a tougher relative schedule. For example, a +7 difference means the team ranked 7 spots above their average opponent. A -18 difference means they ranked 18 spots below. This metric reveals schedule strength relative to each team's own ability, which raw opponent strength doesn't capture.
Games Played (GP)
Each team plays a minimum of 3 games in the group stage. Eliminations in different rounds mean different game totals: 4 games for round of 32 eliminations, 5 for round of 16, 6 for quarterfinals, 7 for semifinals, and 8 for finalists. Since teams don't play equal matches, statistics in the study are measured per match rather than totals. This metric helps determine if higher-ranked teams advance further, as expected.


