Zlatan Ibrahimovic was sitting in the Fox studio in Los Angeles on Friday night when somebody asked him whether the United States could win this World Cup. The former Sweden megastar, a man not known for understatement, gave the most direct possible answer.
"Yes."
A few hours earlier, in the locker room after the 2-0 win over Australia in Seattle, U.S. defender Chris Richards said something nobody on this team has said publicly in a long time. "I don't think it's ridiculous to say that we want to win it," Richards told reporters. "We want to lift a trophy by the end of this." Tim Ream, the team captain and the most stoic veteran on the roster, broke down in tears on the field as the team huddled. He could not explain why. Mauricio Pochettino threw his arms in the air and led the crowd at Lumen Field in a U-S-A chant.
In 96 years of World Cup soccer, the United States has never made anyone outside its own borders use those words. "Win the World Cup" is not a phrase that has historically lived in the same paragraph as "USMNT." It does now.
The Athletic's lead soccer columnist wrote a piece on Saturday morning with the headline, "It's (finally) OK to dream big about USMNT and World Cup." ESPN ran a near-identical story. Twitter is wall-to-wall takes about brackets and matchups. The bandwagon is full and the people are loud and the question on every American's mind right now, halfway through the group stage of the first home World Cup in 32 years, is simple and direct.
How far can this team really go?
This is what we do at the Samford University Center for Sports Analytics. We let the data answer the questions everyone is asking. A month ago we published a player-by-player look at the 2026 USMNT roster and where each player came up through American soccer. The headline finding was that the modern American team is a real and credible side, built from a global pipeline of European academy talent that did not exist in 1994, but still a tier or two below the world's elite. We projected a realistic ceiling of the Round of 16 and called a quarterfinal appearance plausible.
That was the analytical baseline before a ball was kicked. Two games in, this team has done everything that baseline said it should. The 4-1 dismissal of Paraguay was the most goals an American team has ever scored in a single World Cup match. Folarin Balogun's two goals in that match made him the first American in 96 years to score twice in a World Cup game. The 2-0 win over Australia was the U.S.'s first back-to-back World Cup wins since 1930. The team is through to the Round of 32 as the winner of Group D, and the meaingful game will be played at Levi's Stadium in Santa Clara on July 1, in front of an American crowd, in the same time zone the team has been playing in all month.
But none of that is the question being asked anymore. The question being asked is the next one. Now that this team has cleared the bar everyone set for it, how much higher can it go?
We ran the numbers. Specifically, we looked at how every World Cup host country since 1994 has performed relative to what their pre-tournament talent baseline would have predicted. We looked at where the United States actually sits on that historical spectrum. We looked at what hosts have done, what hosts have never done, and what the United States would have to do to write its name into a chapter of World Cup history that has not yet been written.
The short version, before we get into how we got there:
A quarterfinal is in reach. A semifinal would be one of the great American sports stories of the modern era. A final would match the most surprising tournament run of the last twenty years. Winning the World Cup would put this team in territory no host has ever entered.
Each of those statements is supported by the data. Let us walk through it.
How To Tell, In Advance, How Far A Team Will Go
There is one statistic that predicts World Cup performance better than any other single number. It is not population. It is not GDP. It is not FIFA ranking, which has known structural problems that make it unreliable as a forecasting tool. It is the total minutes that a country's players logged the previous season in the five top European leagues.
The sport calls those leagues the Big Five. The English Premier League, Spain's La Liga, Germany's Bundesliga, Italy's Serie A, and France's Ligue 1. Together they are where the global concentration of elite soccer talent plays week in and week out. Being a regular on one of those clubs is roughly the operational definition of being an elite-tier professional, the soccer equivalent of being on an NBA roster or an NFL roster.
Looking at the 192 teams that participated in the six World Cups from 2002 through 2022, the relationship between a country's Big Five minutes in the season before a tournament and that country's final tournament rank correlates at Spearman rho equals minus 0.50. That is a large, statistically significant correlation by social science standards, and it holds across every World Cup in the dataset.
To understand where a team is likely to finish, the cleanest move is not to ask what the "average" looks like at each tier. The averages are distorted by occasional disasters (Spain in 2014 had 527,000 Big Five minutes and crashed out in the group stage). The right question is more direct. For teams at a given minute level, what fraction of them actually advance, and how far?
The breakdown by minute band tells the story:
Teams with under 15,000 Big Five minutes: 73 percent exit at the group stage. The Costa Ricas, Saudi Arabias, Hondurases of the world. Occasional surprises happen here (South Korea 2002 came from this band) but they are rare.
Teams with 15,000 to 30,000 minutes: 51 percent exit at the group stage. About a third make the Round of 16. Quarterfinal runs from this band are uncommon but not unheard of.
Teams with 30,000 to 45,000 minutes (the U.S. peer cluster): Of the 24 teams in this exact band across the last six World Cups, 13 exited the group stage. Seven made the Round of 16. One made the Quarterfinal. Three made the Semifinal or better. Roughly half advance from groups, with meaningful but small chances of a deeper run.
Teams with 45,000 to 75,000 minutes: Two-thirds advance from the group stage. About a fifth make the Quarterfinal or better.
Teams with over 75,000 minutes: Almost always advance from the group stage. Most are tournament contenders.
The 2026 United States sits at 35,885 Big Five minutes for the entire American player pool last season, across 30 American players who logged time in those leagues. Of those 30, thirteen are on Mauricio Pochettino's 26-man World Cup roster. That 35,885 number is what is comparable to other countries' totals.
The U.S. lands in the 30K-to-45K band, the band where teams advance from groups about half the time. The country's closest peers by 2025-26 Big Five minutes are Serbia (35,212), Sweden (35,512), Norway (42,064), and Croatia (43,923). For context, the powerhouse nations the U.S. is still working to catch produced an entire order of magnitude more last season. Spain logged 505,019 Big Five minutes, France 373,593, England 233,879. Australia, also in Group D, logged only 8,120, and Paraguay just 7,746. Türkiye had 25,991.
By the Big Five metric, in other words, the United States is a team that historically has roughly a coin-flip chance of advancing from the group stage on talent alone, with a real but small chance of a deeper run. That is the starting line. It is also why the host effect matters so much.
What We Just Watched
One thing worth flagging before the host analysis. The Big Five framework did not just identify the U.S. as a competitive team in the abstract. It identified the U.S. as the strongest team in Group D specifically. The U.S. had 35,885 Big Five minutes in 2025-26. Türkiye had 25,991. Australia had 8,120. Paraguay had 7,746. The Americans had more Big Five minutes than the other three teams in their group combined. By the metric, the U.S. was supposed to win this group.
The U.S. won the group.
That matters because it means the framework is forward-looking, not just a useful way to describe past results. The system that has worked across six previous World Cups predicted this one too. So when we apply the framework to the question of how far the U.S. can go from here, we are not just looking backward. We are using a tool that has already shown it can predict.
Which brings us back to the question on everyone's mind. The U.S. has done what the talent says it should do at home. How much more does playing at home actually add?
The Host Effect, Measured
For every World Cup since 1994, we pulled the host country's Big Five minutes in the season immediately preceding the tournament and compared that to where the host actually finished. The dataset includes nine host-instances across eight World Cups (the 2002 tournament was co-hosted by South Korea and Japan).
For each host, we asked: based on the team's Big Five minute level, what was the typical finish for non-host teams in that same band? And how far did the host actually go? The gap between the two is the host bonus.
Table 1: World Cup Host Country Performance, 1994 to 2022
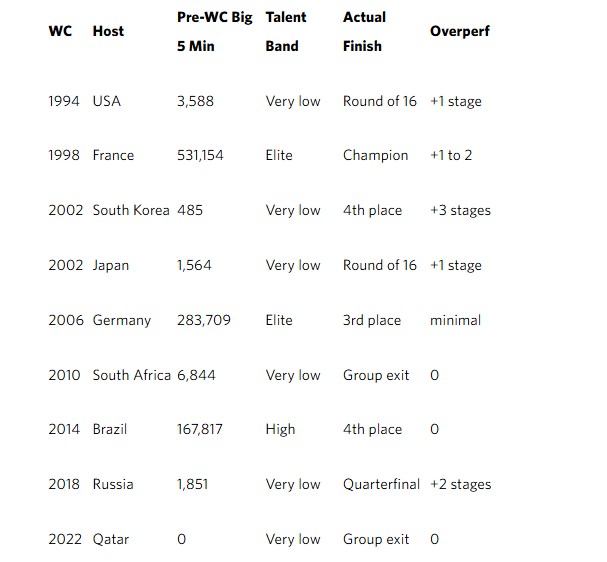
The pattern is real but uneven. The average host since 1994 has finished roughly one stage further than what the talent baseline alone would predict for a non-host team in the same minute band. The median is the same. The range is wide. South Korea 2002 made the semifinals from a baseline that would have expected almost any other team to exit at the group stage. Russia 2018 made the quarterfinals from almost the same baseline. On the other end, South Africa 2010 and Qatar 2022 hosted and got nothing extra. The host bonus is real, but it is not automatic.
Two observations sit inside this data.
First, the host effect is real, but it is not dramatic on average. Most hosts advance about one round further than their talent baseline alone would predict. A team expected to exit at the group stage typically reaches the Round of 16 instead. A team expected to make the quarterfinal often makes the semifinal.
Second, the famous host overperformances are outliers, not the norm. South Korea 2002 is the most extreme case in modern history, and even that team had a generation of players (Park Ji-sung, Lee Young-pyo, Hong Myung-bo) who would soon be transferring to Big Five clubs themselves. Russia 2018 reached the quarterfinal from a baseline of two Big Five players. These are real overperformances, but they are not the average. Half of all hosts since 1994 have overperformed by one stage or less. Two hosts (South Africa 2010, Qatar 2022) have not overperformed at all.
The American baseline matters here. The U.S. enters 2026 with 35,885 Big Five minutes. That is 10x higher than South Korea 2002, 20x higher than Russia 2018, and 5x higher than South Africa 2010. By Big Five minutes, the U.S. is not a low-tier host. Among hosts since 1994, only France 1998, Germany 2006, and Brazil 2014 had higher pre-tournament Big Five totals. The U.S. is more like a mid-tier host with a meaningful baseline, not a Korea or Russia underdog magnitudes below the talent floor.
This matters because the U.S. does not need a Korea 2002-level miracle to reach the quarterfinal. The U.S. is starting from a baseline where the quarterfinal is reachable with an average host bonus.
The Amplifier: A Home Crowd, In Soccer Specifically
The standard host bonus is essentially a measurement of one thing: home-field advantage in a sport where home-field advantage is unusually large. Soccer has the largest, most persistent, most empirically demonstrated home-field effect of any major team sport, and the research on it spans more than a century of league play across multiple countries.
The numbers are striking. In the English Premier League, home teams have won roughly 46 percent of all matches across the 33 seasons since the league was founded in 1992, with only about 26 percent of matches won by the away side and the rest drawn. This is a remarkably stable pattern. Across more than 13,000 EPL matches, home teams consistently win at a rate 15 to 20 percentage points higher than visitors. The effect is even larger in the lower divisions of English football. In Major League Soccer, the home win rate runs higher still, at 69.1 percent according to recent league data.
This is not a quirk of any single league. Jim Albert and Ruud Koning's analysis of nearly 9,000 international matches from 1993 to 2004 found that international home sides won 50.5 percent of their games, compared to 24.5 percent for away sides. Elite footballing nations, the analysis found, win at home at rates above 60 percent.
The cleanest natural experiment on this came during the 2020-21 EPL season, when COVID-19 restrictions forced teams to play in empty stadiums. The home advantage that had held for more than a century collapsed. Home win rates fell from their long-run average of 46 percent to below 38 percent, the lowest figure in Premier League history. When fans came back, the home advantage came back with them. The conclusion in the analytics literature is that crowd support is the primary driver of soccer home advantage, with pitch familiarity and reduced travel playing supporting roles.
This matters for the 2026 United States because the U.S. will play in front of a home crowd for every single match of the tournament. The U.S. is the only team in the entire field of 48 whose supporters dramatically outnumber visiting supporters at every venue, in every round, including the final at MetLife Stadium if the U.S. gets there. No other host country in the modern era has played its entire World Cup run in stadiums where home support is this overwhelming. Mexico will play home games in Mexico, but Mexico will travel to the United States for any knockout matches outside the Western corridor. Canada is in a similar position. Only the United States plays every game in front of an American majority crowd.
The standard host bonus, as we measured it in the historical data, is already roughly one stage of overperformance. The 2026 U.S. should expect at least that. Whether it ends up being more depends on factors no historical dataset can capture, including how well the team holds up under the unprecedented attention of a home World Cup, whether the home crowd produces the kind of atmosphere that has carried other host runs, and how the bracket unfolds.
The Realistic Ceiling
When you put it all together, the talent baseline (a coin-flip to advance from groups on talent alone) plus the historical host bonus (roughly one stage of overperformance on average) plus the soccer-specific home crowd advantage that the U.S. uniquely has in this tournament, the realistic ceiling for the 2026 USMNT is the quarterfinal-to-semifinal range. Each stage beyond that becomes progressively harder to justify by the data.
Table 2: U.S. Scenario Analysis
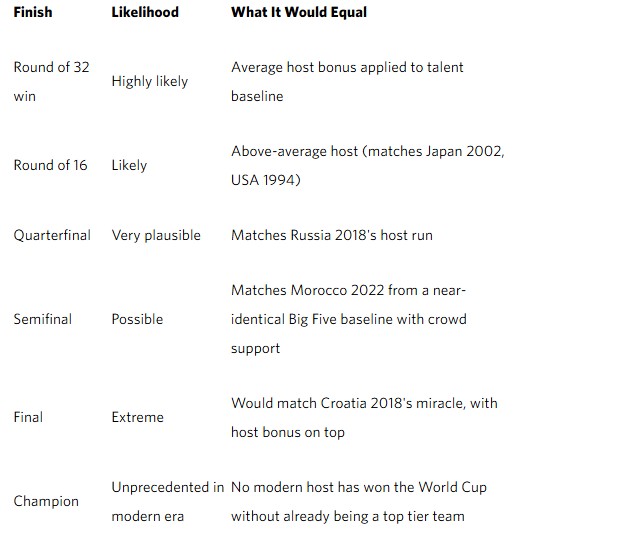
To understand what each level of finish requires historically, consider:
A Round of 32 win would be the modern equivalent of the 1994 host U.S. advancing from the group stage. That team had 3,588 Big Five minutes. The 2026 team has 35,885. The Round of 32 should be the floor, not a stretch.
A Round of 16 finish would equal the 2014 and 2022 U.S. teams. The 2014 USMNT had 20,729 Big Five minutes. The 2022 USMNT had 28,364. The 2026 team has 35,885 plus a host bonus. The Round of 16 is the baseline expectation.
A quarterfinal would be the deepest U.S. World Cup run in the modern era. The last American team to reach the quarterfinal was 2002, which lost 1-0 to Germany in Korea/Japan. That team had 14,346 Big Five minutes. The 2026 team has more than double that, plus a home tournament. The quarterfinal is plausible and arguably expected if the host effect plays out as the historical average suggests.
A semifinal would match the deepest U.S. World Cup performance in 96 years. The 1930 U.S. team finished third, but the field was 13 teams, the tournament had no group stage, and the U.S. lost its only semifinal 6-1. A modern-era semifinal would be the deepest American World Cup run by any reasonable interpretation of the data. The closest historical parallel here is Morocco 2022. Morocco entered Qatar with 38,716 Big Five minutes, almost identical to the U.S. 2026's 35,885. Morocco also benefited from something close to a host advantage in Qatar, where the large Moroccan and broader Arab and Muslim diaspora gave the team home-style crowd support throughout its run. Morocco reached the semifinals and finished fourth, defeating Spain and Portugal along the way. The U.S. enters 2026 with a similar Big Five baseline and a meaningfully larger home crowd advantage, since the U.S. is the actual host, not just a fan favorite. A semifinal run is possible. The Morocco precedent shows it is more than a theoretical possibility.
A final appearance would match Croatia 2018, which made the final with 43,200 Big Five minutes. The U.S. has 35,885. The numerical comparison is striking, but Croatia 2018 was Croatia. The 2018 Croatian squad featured Luka Modrić, Ivan Rakitić, Mario Mandžukić, and a Real Madrid Champions League midfield. The Croatian domestic league does not match MLS in current depth. The comparison is imperfect, but the data point exists: a team with a Big Five footprint near the American level has reached a World Cup final in the modern era. Once.
Winning the World Cup is where the data turns honest.
What the Data Says About Host Champions
Six teams have hosted and won the World Cup: Uruguay 1930, Italy 1934, England 1966, West Germany 1974, Argentina 1978, and France 1998. Every one of them was already a top-tier soccer power when they hosted. France 1998 had 531,154 Big Five minutes in the season before their tournament. The 2026 U.S. has 35,885.
In the modern era of globalized soccer, the eight World Cup champions since 1994 had the following Big Five totals heading into their tournament:
- 1994 Brazil: 34,026 (the only modern champion with fewer Big Five minutes than the U.S. 2026)
- 1998 France: 531,154
- 2002 Brazil: 134,034
- 2006 Italy: 539,859
- 2010 Spain: 498,692
- 2014 Germany: 313,730
- 2018 France: 417,475
- 2022 Argentina: 106,394
Seven of the eight champions had over 100,000 Big Five minutes. The one true exception is Brazil 1994, which won the tournament with 34,026 Big Five minutes, a figure close to the U.S. 2026's current 35,885. That comparison comes with an important caveat. The Brazilian domestic league in the 1990s was arguably the strongest non-European league in the world, with depth and quality that compares favorably to current MLS. Brazil 1994 had Romário, Bebeto, Dunga, Branco, and Taffarel, several of whom played outside the Big Five in leagues that were elite at the time. Big Five minutes alone did not capture the full picture of Brazilian talent in 1994. The metric was simply less central to where elite players played than it is today.
The 2026 U.S. has Christian Pulisic, Weston McKennie, Tyler Adams, and Antonee Robinson playing meaningful Big Five minutes. The U.S. also has Major League Soccer as the domestic supplement. MLS has improved dramatically over the last decade. But MLS does not yet match the 1990s Brazilian Série A in producing tournament-decisive talent. The U.S. would need to overcome the largest "elite talent gap" of any modern World Cup champion. The math is honest.
Winning the 2026 World Cup would mean doing something never done in the era of globalized European club soccer. It is not impossible. Sport rarely is. But the analytical and historical case for it is the weakest case in this article, and we will not pretend otherwise.
The Three Weeks Ahead
The structure of the 2026 World Cup is new. With 48 teams and a Round of 32, the U.S. now needs three knockout-round wins, not two, to reach what we would have called the quarterfinal in 2022. That is a meaningful change. The 2026 USMNT has to win one more knockout game than past American teams to match what we have historically called a "deep run." This makes the project more demanding in real terms, even as the talent and host conditions are more favorable.
Each subsequent win, from here, corresponds to a different tier of historical comparison:
- Win the Round of 32 (July 1, Santa Clara): Matches the average host bonus. Expected.
- Win the Round of 16: Matches an above-average host like Japan 2002. Likely.
- Win the Quarterfinal: Matches Russia 2018 (host who reached the semifinal). Very plausible.
- Win the Semifinal (reach the Final): Matches Croatia 2018 (non-host who reached the final from a similar baseline). Possible but rare.
- Win the Final: Matches no modern host who hasn't already been a top tier talent. Unprecedented.
The U.S. could go three rounds deep before the math starts saying "you're now exceeding what hosts in your talent tier have done." That is the realistic ceiling.
Believe, But Know the History
The data is honest, and the data says the quarterfinal is plausible and the semifinal is possible. The data also says that winning the World Cup would be the largest host overperformance in the modern history of the tournament. Both things are true.
Here is what is also true. The 2026 USMNT is performing better than the data projected. The on-field results in Group D have matched or exceeded the analytical baseline. The team has won its first two World Cup matches for the first time in 96 years. And the team is playing every match in front of an American crowd in a sport where crowd support is the single most measurable home-field amplifier in the analytics literature.
Could this team reach the semifinal? The data says yes. It would be historic. It would be the deepest U.S. World Cup run in the modern era. It would put the United States on the same page in the history book as South Korea 2002 and Morocco 2022, two of the most stirring tournament stories in recent memory.
Could this team reach the final? The data says it would be extreme but not impossible. It would match Croatia 2018, a Modrić-led Croatian generation that fans of that country will tell you only comes along once a century.
Could this team win the World Cup? The data says it would be unprecedented in the modern era of globalized soccer. The data says no host has done it without already being a top-tier team. The data says the U.S. is not a top-tier team yet.
But sport, blessedly, is not just data. Sport is also surprise, and chemistry, and individual moments of brilliance, and the kind of belief that turns a quarterfinal team into a semifinal team and a semifinal team into a finalist. The U.S. has none of the talent-pool depth of a championship-favorite team. The U.S. does have a 26-man roster, a coach in Mauricio Pochettino who has been to a Champions League final, and a draw that has not yet thrown anything they cannot handle.
The team believes that it can win. The chant, "we believe that we can win," has been the soundtrack of American soccer for a generation, and it is being sung louder this month than at any time in the last 32 years.
We believe. But we also know the history.
The quarterfinal is the realistic ceiling. The semifinal would be historic. Beyond that, this team would be writing the kind of story that has not been written before.
That, of course, is exactly why we watch.
Methodology and Sources
The host effect analysis covers nine host-instances across eight World Cups from 1994 to 2022. Pre-tournament Big Five minutes for each host are drawn from the FBref Big Five European Nationalities longitudinal dataset, 1990 through 2026. Tournament finishes are sourced from the official FIFA archive. The expected-finish framework uses tier averages computed from a 192-team correlation analysis of the same data, with full methodology available at samford.edu/sports-analytics. Net host bonus is computed by subtracting the average overperformance of same-tier non-host teams in the same tournament from each host's overperformance.
Home-field advantage research is drawn from: Premier League home/away win-rate data covering all 33 seasons of league play since 1992, including the 2020-21 empty-stadium natural experiment; Albert and Koning's analysis of nearly 9,000 international matches from 1993 to 2004; and published research on Major League Soccer home advantage rates. All cited statistics are publicly available.
The 2026 USMNT roster is the 26-player squad announced by head coach Mauricio Pochettino on May 26, 2026, in Manhattan. Pre-tournament Big Five minute totals for the U.S., Türkiye, Australia, and Paraguay are from FBref's 2025-26 dataset.
This analysis was supported in part by computational assistance from Claude (Anthropic) for data verification, statistical analysis, and chart preparation. All findings, framing, and editorial decisions are the authors'.
About the Authors
Dr Darin W. White is the Executive Director of Samford University's Center for Sports Analytics in Birmingham, Alabama. A former hall-of-fame college soccer coach who led youth programs to nine state championships over 15 years, he has conducted research on the cultural and economic dimensions of sport that has been cited in the Wall Street Journal, the Los Angeles Times, Forbes, the Washington Post, NPR, and Sports Illustrated. He can be reached at dwhite1@samford.edu.
Daniel W. White is a co-author of this analysis. He holds an MBA in Data Analytics from Samford University and a Master of Arts in Sport Management from the University of Alabama, and is a graduate of Samford's Sports Industry program in the Brock School of Business. He spent four years in marketing leadership at World Soccer Shop, the second-largest e-commerce soccer retailer in the United States, where he worked directly with Adidas, Nike, and Puma on joint marketing campaigns. A former competitive soccer player, Daniel won five Tennessee Division I state championships, represented Tennessee in the U.S. Soccer Olympic Development Program, and played college soccer before entering Samford's Sports Industry program. He brings a deep, first-hand knowledge of global club football to the analysis.